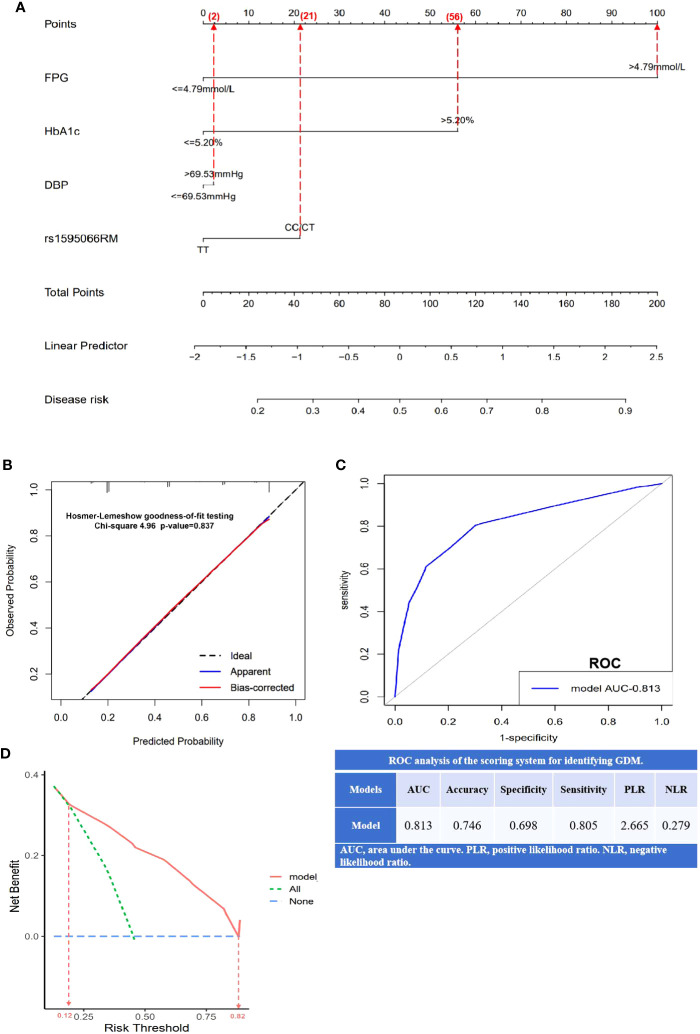
Figure 3.
Establishment and validation of nomogram model for predicting GDM risk. (A) A nomogram model constructed using FPG, HbA1c, DBP, and rs1595066, based on binary logistic regression. The value of each variable was scored on a point scale from 0 to 100, after which the scores for each variable were added. That sum is located on the total points axis, which enables us to predict the probability of GDM risk; (B) the calibration curve was evaluated by Hosmer–Lemeshow goodness-of-fit testing with a p-value of 0.837; (C) the area under the receiver operating characteristic curve (ROC) and the scoring system for identifying GDM; (D) the decision curve analysis (DCA) with higher clinical bet benefit in probability threshold in 0.12 to 0.82.

