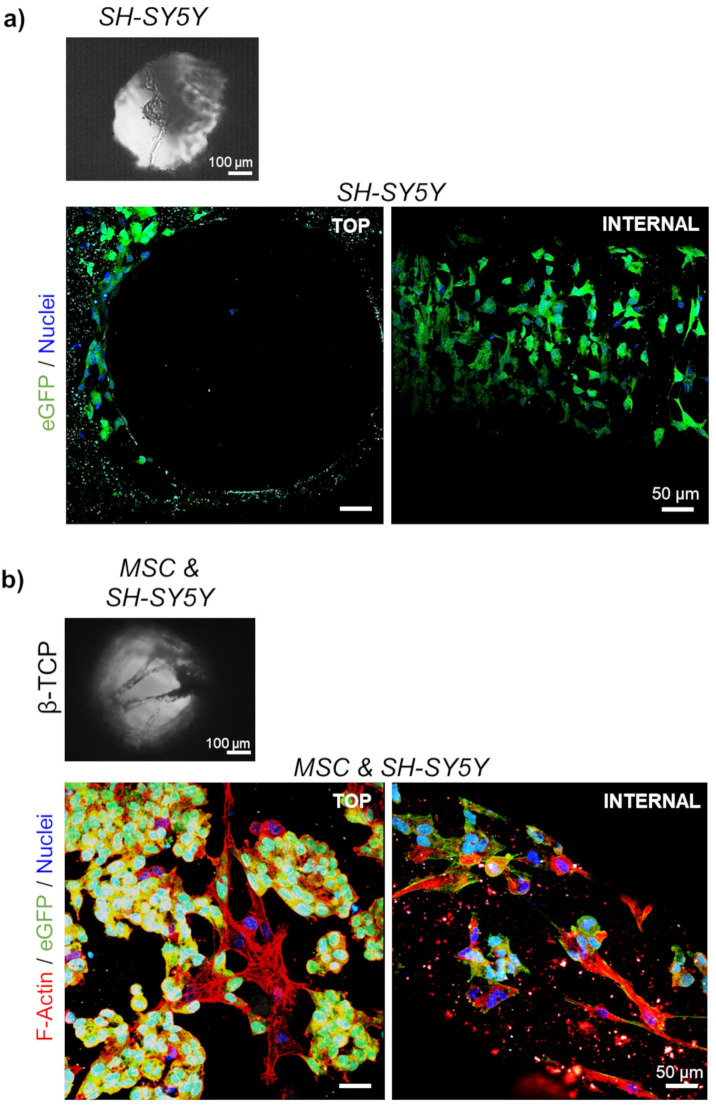
Figure 3.
Organization of the cells in 3D growth condition: Light microscopy of a) mono-cultured neuroblastoma (SH-SY5Y) cells or b) neuroblastoma cells co-cultured with differentiating MSC for 7 days. SEM micrographs correspond to the top views inside the interconnected channels. Scale bar, 100 μm. Two-photon microscopy images show cell organization - top view and internal investigation (after cutting the scaffolds). Phalloidin (F-Actin) - red; DAPI - cell nuclei (blue); eGFP - neuroblastoma cells (green). Scale bar, 50 μm.

