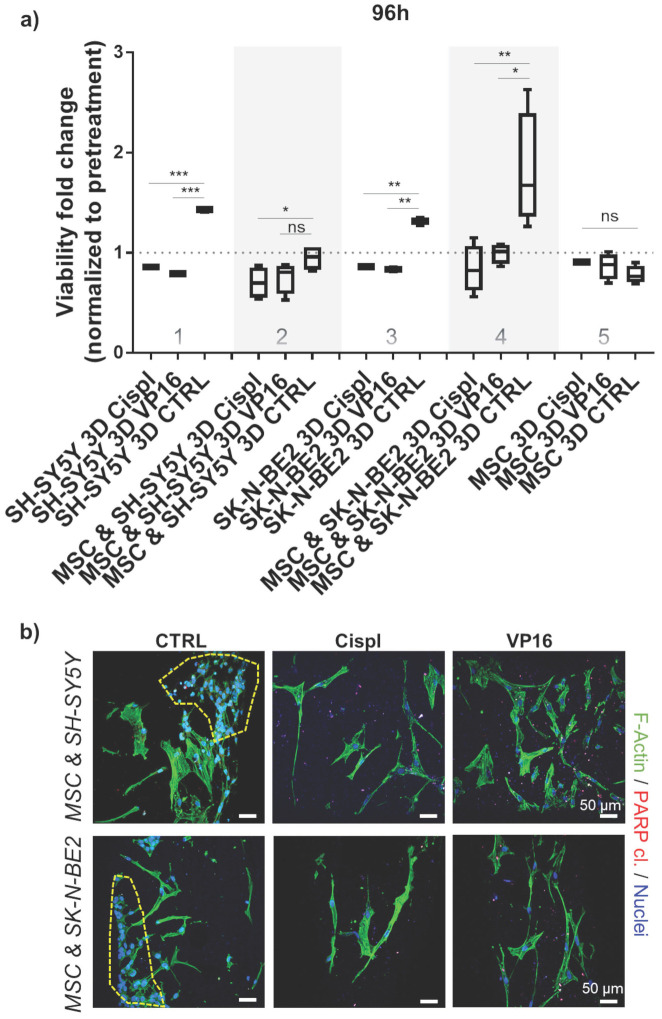
Figure 5.
Chemotherapeutic concentration adjustment under 3D growth: a) Viability of neuroblastoma cells (SH-SY5Y and SK-N-BE2) was assessed 96 hours post-treatment with 10 μM of VP16 (Etoposide) or Cispl (Cisplatin). Cell mono- and co-cultures were compared. Viability corresponding to 1 (equal to 100 %) presents a normalized values obtained by CCK-8 assay before adding chemotherapeutics. MSC from a new donor were considered. CTRL - DMSO treated control cells. *p<0.05, **p<0.01, ***p<0.001, ns - not significant. b) Two photon microscopy images of 3D co-cultures treated with VP16 or Cispl. DMSO treated samples served as control (CTRL). Internal investigation was performed after cutting the scaffolds. Phalloidin (F-Actin) - green; cleaved PARP protein - residual red puncta; DAPI - cell nuclei (blue). Dashed yellow lines gather major neuroblastoma cell clusters. Scale bar, 50 μm.

