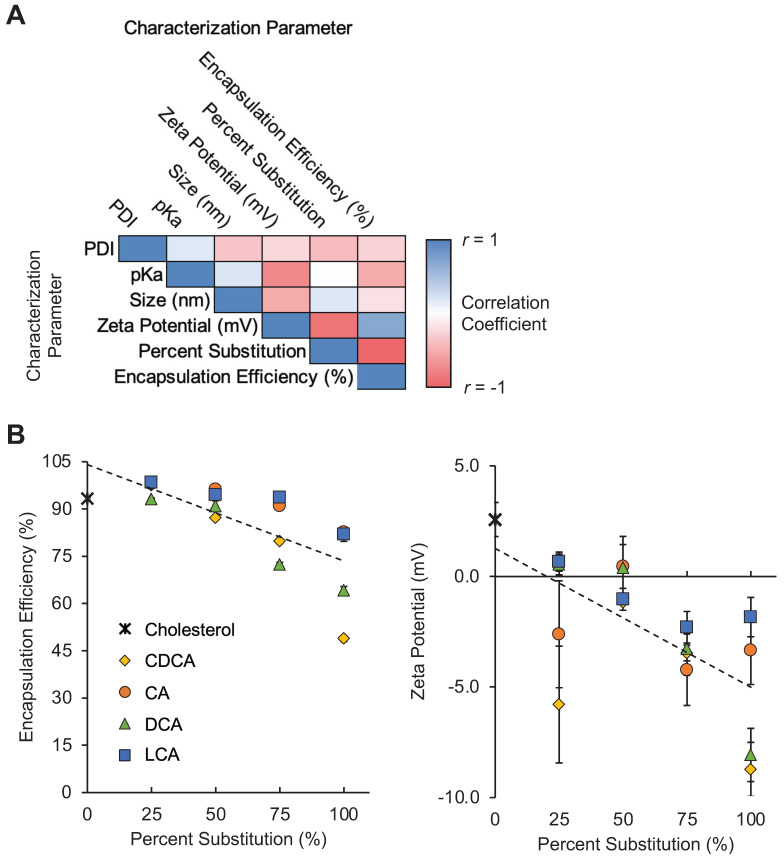
Figure 2.
Characterization of LNP formulations containing various amounts of bile acids. (A) Correlation matrix of characterization parameters for the 17 LNPs in the library (16 BA-LNP formulations and 1 base formulation). LNPs were grouped by percentage substitution (0, 25, 50, 75, or 100%). Measured characterization parameters include hydrodynamic size, PDI, encapsulation efficiency, zeta potential, and pKa. n = 3 for all measured characterization parameters. (B) Scatter plots of encapsulation efficiency (left) and zeta potential (right) versus bile acid substitution percentage for the LNP library. Least squares linear regression lines were used to visualize trends. n = 3. Error bars denote standard deviation.

