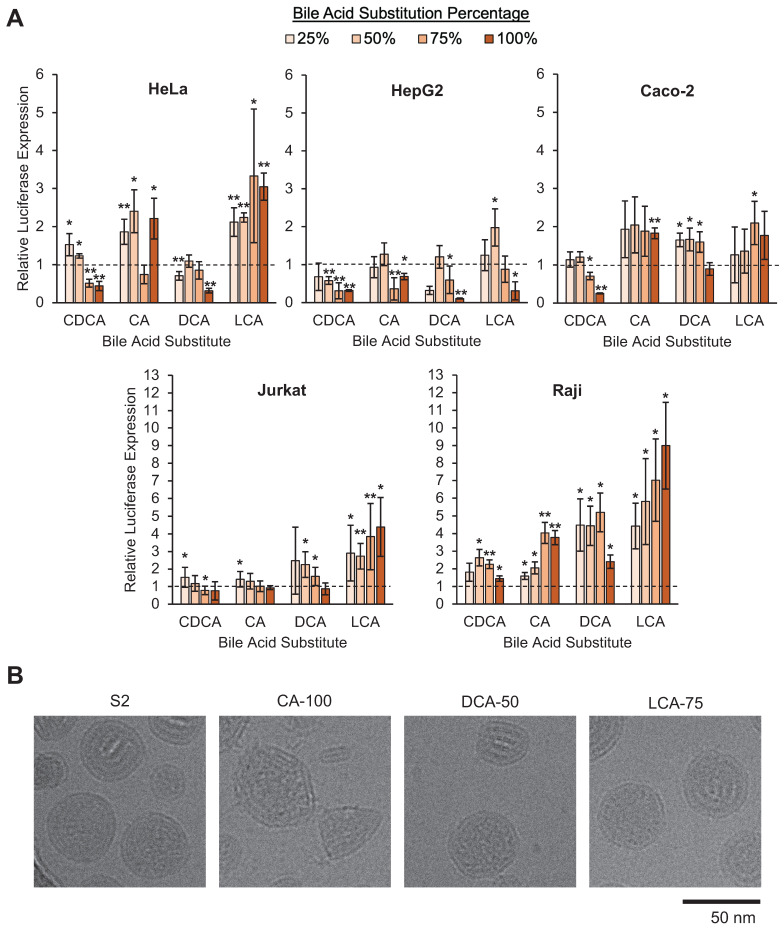
Figure 3.
In vitro screening of the LNP library and morphologic characterization of selected candidates. (A) Luciferase mRNA delivery in various cell lines. Luciferase expression was normalized to cells treated with S2, the base formulation, after background was subtracted. HeLa cervical cancer cells were treated at 10 ng mRNA / 10,000 cells. HepG2 hepatocytes were treated at 10 ng mRNA / 5,000 cells. Caco-2 intestinal epithelial cells were treated at 100 ng mRNA / 25,000 cells. Jurkat T cells and Raji B cells were treated at 60 ng mRNA / 60,000 cells. Legend denotes percent substitution of each bile acid into the S2 formulation. n = 3 biological replicates. Error bars denote standard deviation. An ANOVA was used to determine if treatment group means differed significantly. *: p<0.05. **: p<0.01 in a post hoc Student's t-test between LNP candidate and S2. (B) Representative cryo-electron microscopy images of S2, CA-100, DCA-50, and LCA-75 to identify morphological variation amongst selected LNPs.

