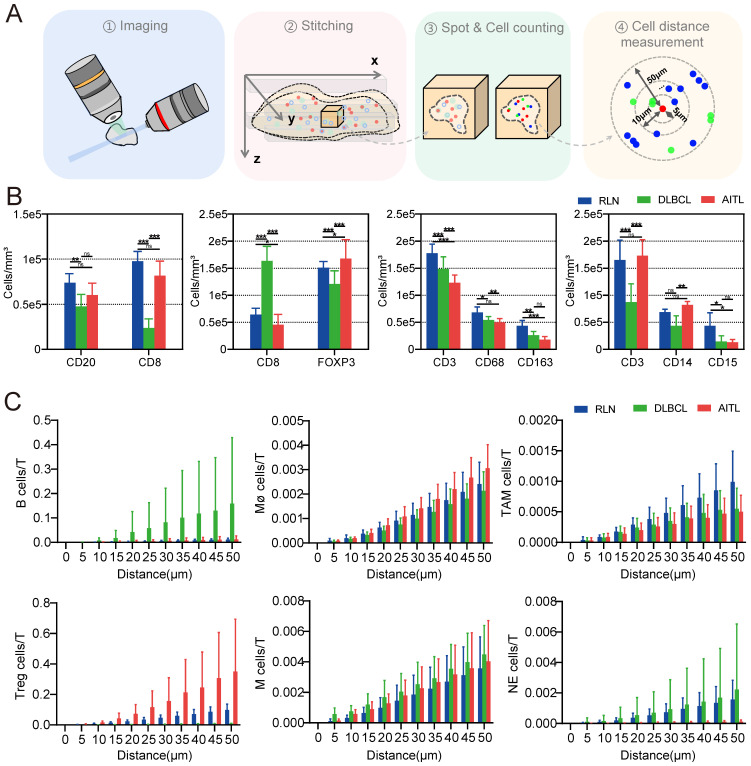
Figure 5.
LSFM image-based data processing flow for analyzing the spatial correlations in the lymphoma TMEs. (A) Post analysis pipeline of the multiplexed LSFM images. (B) The density (cells per mm3) of immune cell types in lymph nodes from three donors with RLN, DLBCL and AITL. i) B cells and T cells: CD20, blue; CD8, red. ii) Tregs and T cells: FOXP3, green; CD8, red. iii) Macrophages, TAMs and T cells: CD68, blue; CD163, red; CD3, green. iv) Monocytes, neutrophils and T cells: CD14, blue; CD15, red; CD3, green. (C) The number of T cells around each immune cell was plotted as a function of the radial distance from the immune cell. Different color bars represent different diseases with blue for RLN, green for DLBCL, and red for AITL.

