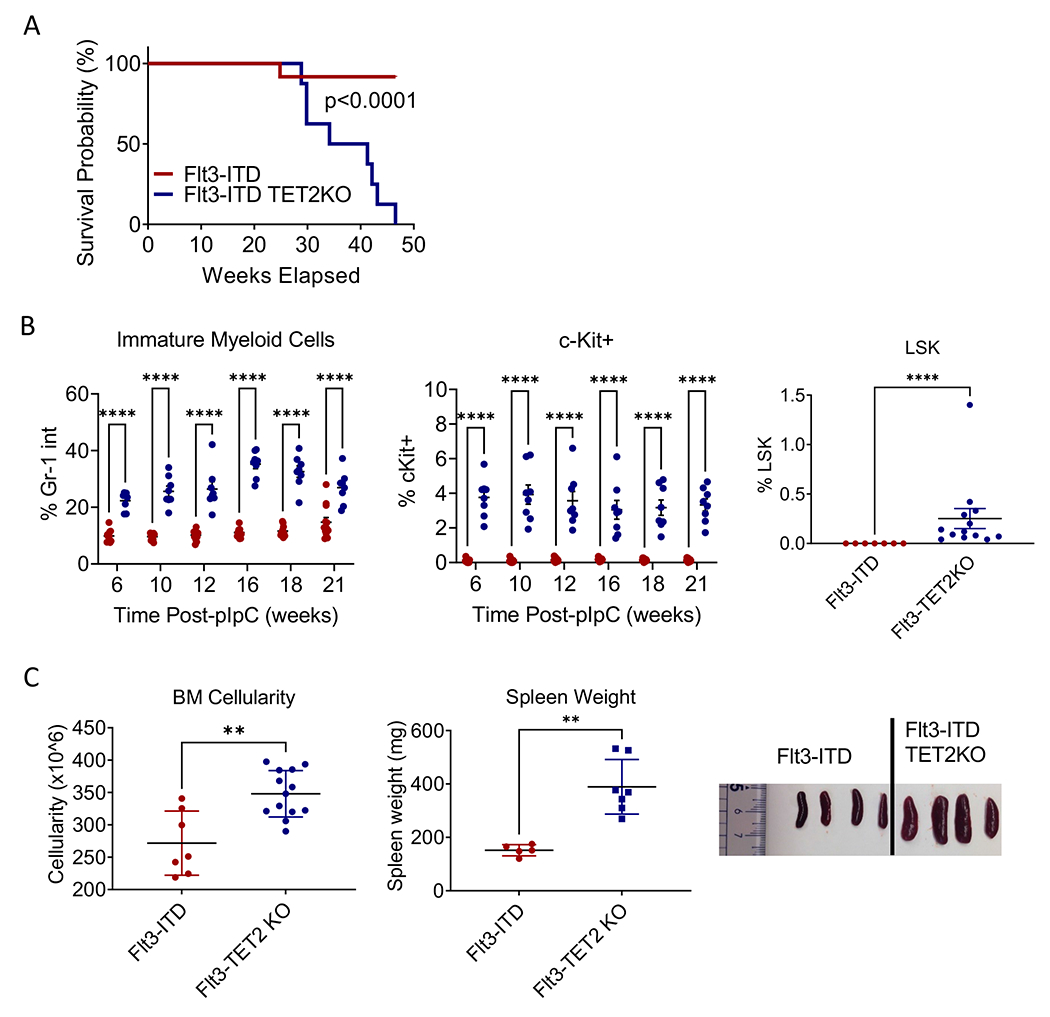
Figure 1. AML development in Flt3-ITD TET2 flox/flox Mx-1 cre mice.

(A) Kaplan-Meier survival analysis for Flt3-ITD and Flt3-ITD TET2-KO mice. (B) Percentage of Gr-1 intermediate immature myeloid cells (left) and percentage of c-Kit positive immature cells (center) in peripheral blood of Flt3-ITD and Flt3-ITD TET2-KO mice over time post administration of pIpC, and frequency of LSK cells in peripheral blood 10 weeks post-pIpC (right). (C) Bone marrow cellularity (left, spleen weights (center), and representative spleen images (right) of Flt3-ITD and Flt3-ITD TET2-KO mice. Significance values: *p<0.05; **p<0.01; ***p<0.001; ****p<0.0001. Results represent mean ± SEM of multiple replicates.
