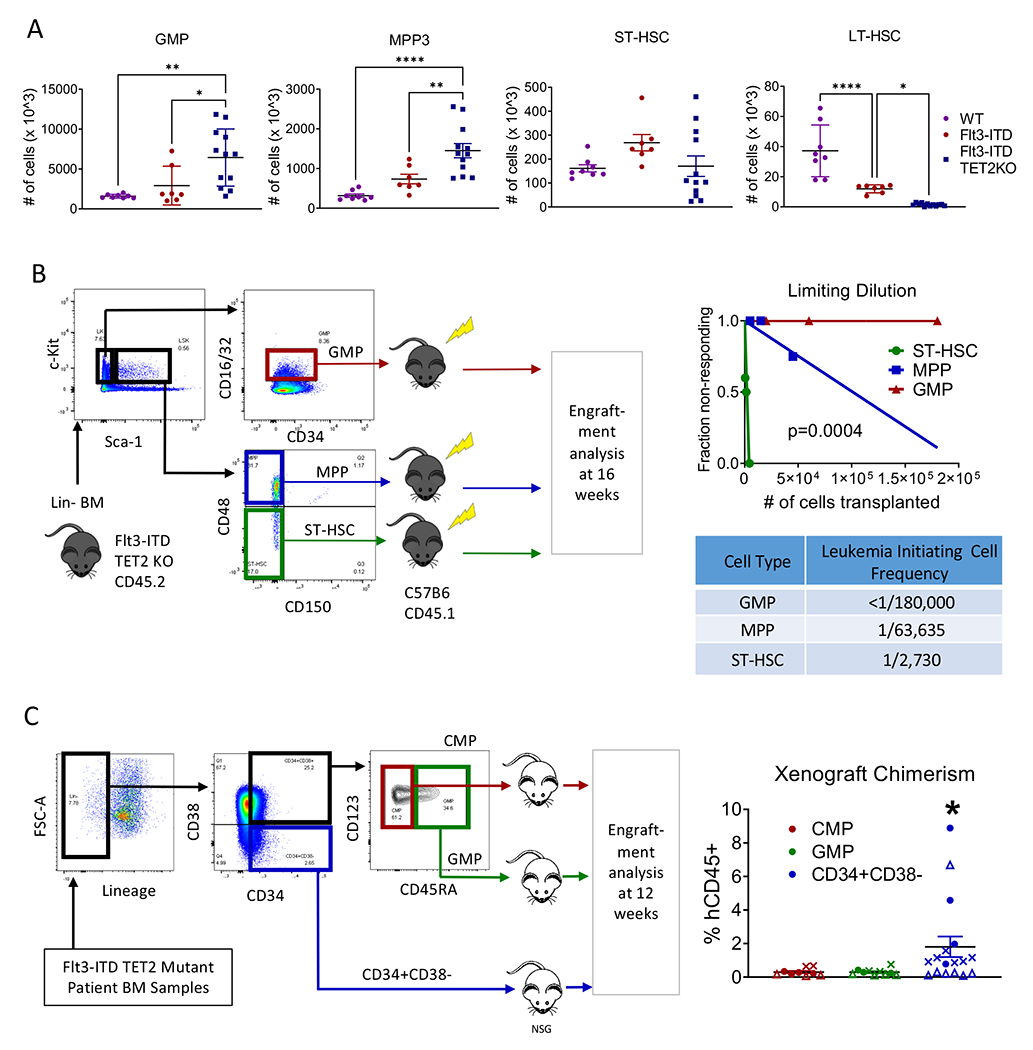
Figure 2. Flt3-ITD TET2-KO LSC reside in primitive phenotypic HSPC compartments.

(A) Bone marrow frequencies of GMP (far left), MPP (left-center), ST-HSC (right-center), and LT-HSC (far right) in Flt3-ITD vs Flt3-ITD TET2-KO mice. (B) FACS sorting and transplantation scheme for limiting dilution transplants of sorted populations to identify leukemia initiating populations (left), limiting dilution plot of cell numbers transplanted (right-upper), and calculated leukemia initiating cell frequency for each population of transplanted cells (right-lower). (C) FACS sorting and xenotransplantation scheme for Flt3-ITD TET2 mutant human AML patient samples transplanted into NSG mice (left) and engraftment of the transplanted populations in NSG mouse xenografts (right). Each symbol represents a unique patient sample. Significance values: *p<0.05; **p<0.01; ****p<0.0001. Results represent mean ± SEM of multiple replicates.
