Figure 3.
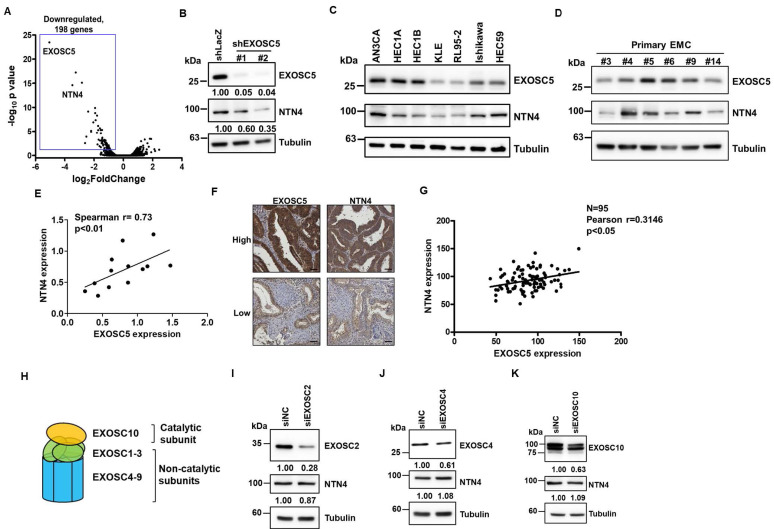
Netrin4 is the potential target of EXOSC5 in EC. (A) Volcano plot depicting differential gene expression between EXOSC5-knockdown and control HEC1A cells based on RNA sequencing analysis. (B) Western blot detection of EXOSC5 and NTN4 protein expressions in HEC1A cells post EXOSC5 knockdown (shEXOSC5#1 or shEXOSC5#2). (C, D, E) Protein expressions of EXOSC5 and NTN4 in multiple EC cell lines (C) and primary EC cells (D) determined by Western blot. Spearman's correlation analysis was used to assess the correlation between EXOSC5 and NTN4 expressions. (F, G) EXOSC5 and NTN4 protein expressions in EC tissue microarray slides were analysed via IHC. Representative images of high or low expression levels of EXOSC5 and NTN4 staining intensities are presented in (F). Pearson's correlation analysis was employed to evaluate the relationship between EXOSC5 and NTN4 expressions (G). Scale bars in (F) represented a length of 50µm. (H) Schematic representation of RNA exosome subunit assembly. (I, J, K) AN3CA cells, transfected with specific siRNA targeting EXOSC2 (I), EXOSC4 (J), or EXOSC10 (K), were harvested for protein analysis via Western blot. siNC represents negative control siRNA.

