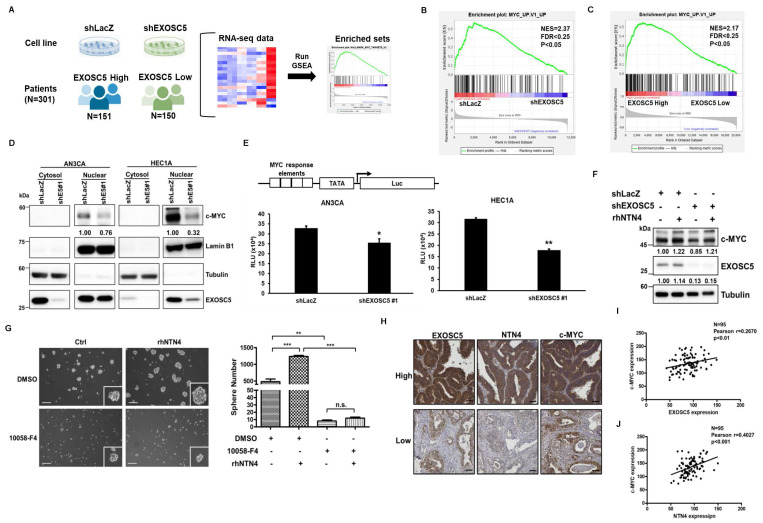
Figure 7.
EXOSC5 upregulates MYC pathway in ECs. (A to C) The schematic diagram illustrating GSEA analytical procedures for the RNA-Seq data from EC cell lines post-EXOSC5 knockdown and EC specimens from the TCGA, categorized based on the median expression level of EXOSC5, is shown in (A). The GSEA analysis of the MYC pathway in EXOSC5-depleted versus control (shLacZ) HEC1A cells is presented in (B), while the GSEA analysis of the MYC pathway in the TCGA ESCA dataset is shown in (C). (D) From EXOSC5-knockdown AN3CA or HEC1A cells (shE5#1), cytosolic and nuclear fractions were extracted, and the expressions of EXOSC5 and c-MYC were probed via Western blot. (E) In both EXOSC5-depleted (shEXOSC5#1) and control (shLacZ) AN3CA or HEC1A cells, the transcriptional activity of c-MYC was assessed using a luciferase-based reporter assay. Data are denoted as mean ± SD. *, p< 0.05; **, p< 0.01 based on Student's t-test. (F) EXOSC5-depleted (shEXOSC5) and control (shLacZ) AN3CA cells were exposed to 50 ng/ml rhNTN4 for 48 hours, after which the expressions of EXOSC5 and c-MYC were evaluated using Western blot. (G) EMC6 cells were treated with 50 ng/ml rhNTN4 either alone or in combination with 10058-F4 (concentration: 100 µM). Subsequently, CSC activity was gauged using a tumorsphere assay. On the left panel, representative images of tumorspheres are shown, while the right panel displays quantification results, expressed as mean ± SD. **, p< 0.01; ***, p< 0.001; n.s., not significant, as determined by Tukey's Multiple Comparison Test. Scale bars represented 100 µm in length. (H, I, J) Protein expressions of EXOSC5, NTN4, and c-MYC in EC tissues were visualized via IHC staining on tissue microarray slides. Representative images highlighting the high/low staining intensities of each protein are provided in (H). Scale bars indicated a length of 50μm. Pearson's correlation analysis was employed to deduce the relationships between EXOSC5 and c-MYC (I) and between NTN4 and c-MYC (J).

