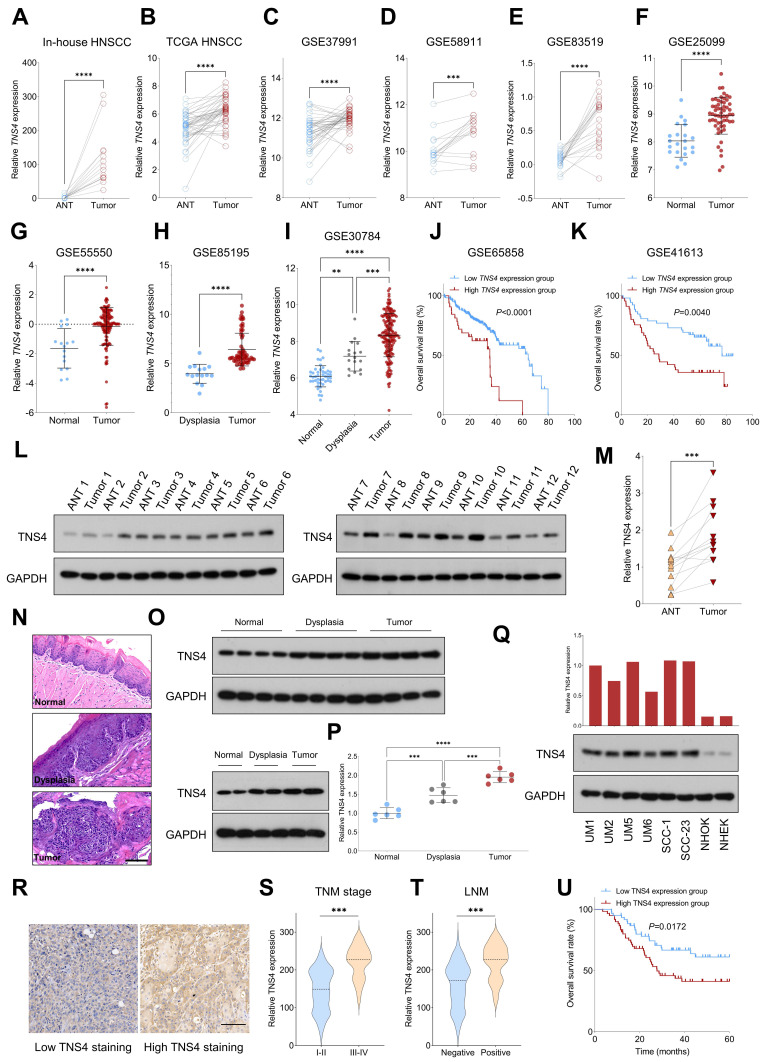
Figure 1.
Elevated TNS4 expression is associated with unfavorable prognosis in HNSCC. (A-E) TNS4 expression in tumor tissues compared to adjacent normal tissues in in-house HNSCC, TCGA HNSCC, GSE37991, GSE58911, and GSE83519. (F-G) The distribution of TNS4 expression in tumor tissues and normal tissues sourced from GSE25099 and GSE55550. (H) TNS4 expression in dysplasia tissues versus tumor tissues in GSE85195. (I) TNS4 expression across normal tissues, dysplasia tissues, and tumor tissues in GSE30784. (J-K) Survival analysis comparing overall survival between HNSCC patients with high and low TNS4 expression in GSE65858 and in GSE41613. (L-M) Western blot analysis of TNS4 expression in tumor tissues and adjacent normal tissues. (N-P) HE staining and TNS4 expression patterns in normal, dysplastic, and tumor tissues derived from the 4-NQO carcinogenesis model (scale bar=100 μm). (Q) TNS4 protein expression in the indicated HNSCC cell lines, NHOK, and NHEK. (R) Representative images of high and low TNS4 staining in HNSCC tissues (scale bar=100 μm). (S-T) TNS4 staining intensity in tumor tissues of advanced stages (III-IV) compared to early stages (I-II), and in tumor tissues with and without LNM. (U) Survival analysis comparing overall survival between in-house HNSCC patients with high and low TNS4 staining intensity.

