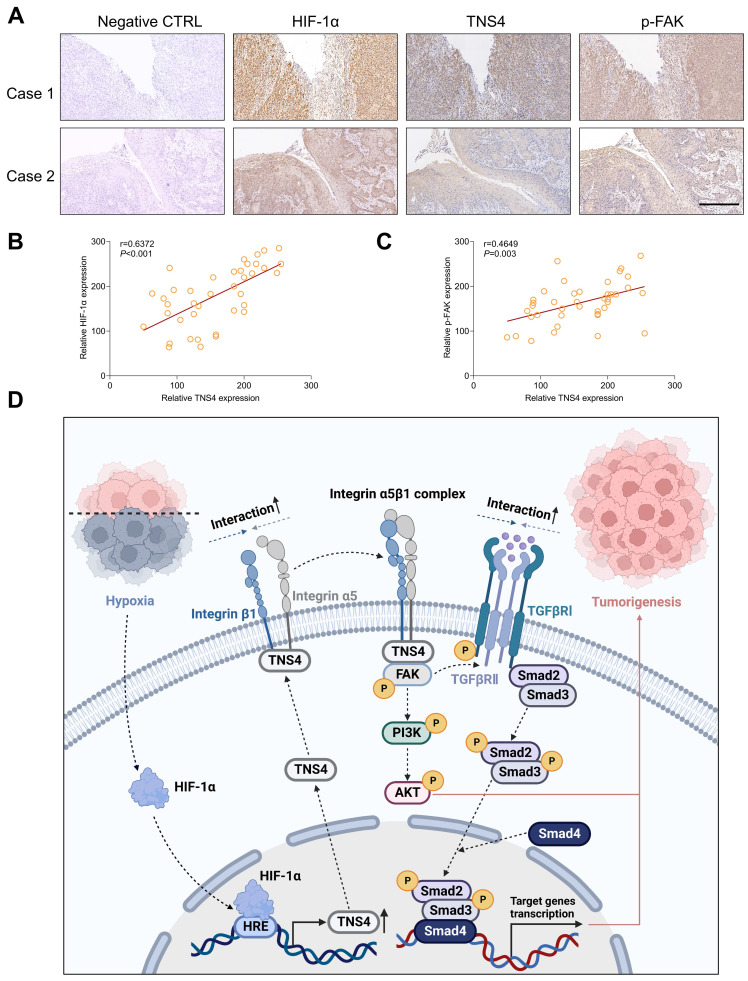
Figure 7.
Clinical relevance of the HIF-1α/TNS4/p-FAK axis in HNSCC. (A) Representative IHC images demonstrating HIF-1α, TNS4, and p-FAK staining in HNSCC cases (scale bar=200 μm). (B) Correlation analysis of staining intensities between HIF-1α and TNS4 in HNSCC. (C) Analysis of the correlation between the staining intensities of TNS4 and p-FAK in HNSCC. (D) Schematic representation of the proposed mechanism underlying the TNS4-promoted progression of HNSCC.

