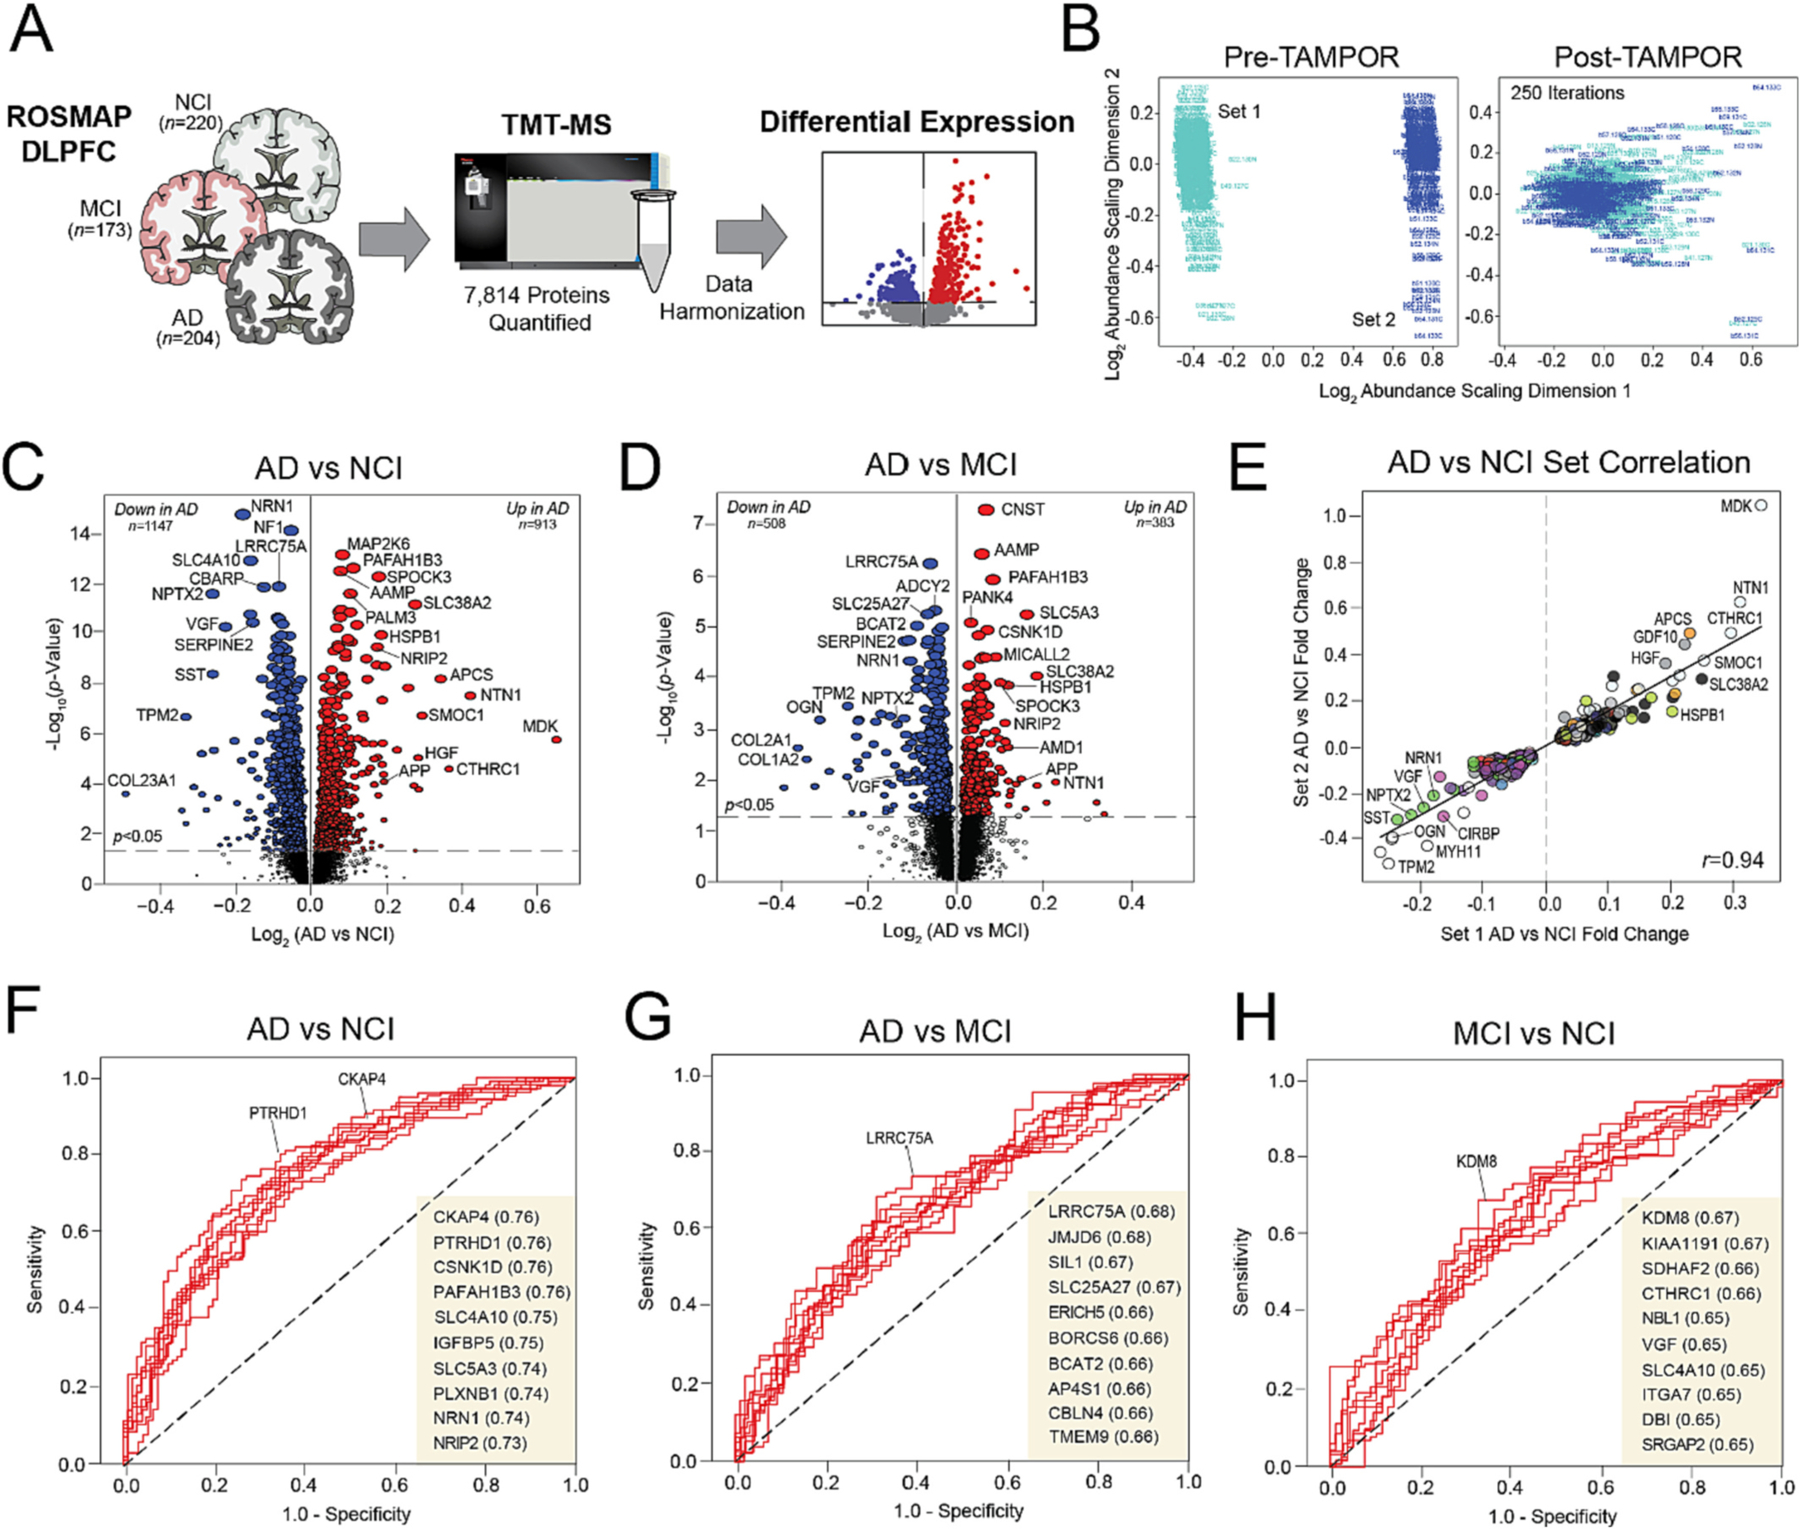
Fig. 2. Proteomic signatures of clinical diagnostic groups.

(A) Study approach for the differential expression analysis of the ROSMAP clinical diagnostic groups. (B) Multidimensional scaling plots displaying case distribution based on inter-sample variance pre- and post-TAMPOR normalization between sets. (C–D) Volcano plots displaying the log2 fold change (x-axis) against the -log10 statistical p value (y-axis) for proteins differentially expressed between pairwise comparisons of the clinical diagnostic groups. All p values across pairwise comparisons were derived by ANOVA with Tukey post-hoc correction. (E) Correlation analysis of Set 1 (x-axis) and Set 2 (y-axis) log-transformed fold changes of proteins differentially expressed (p < 0.05) between NCI and AD cases. The Pearson correlation coefficient is provided. (F–H) ROC curves of the 10 most sensitive and specific proteins for each pairwise comparison by AUC values, which are included in parentheses. Abbreviations: NCI, No Cognitive Impairment; MCI, Mild Cognitive Impairment; AD, Alzheimer’s Disease; TMT-MS, Tandem Mass Tag Mass Spectrometry; TAMPOR, Tunable Median Polish of Ratio.
