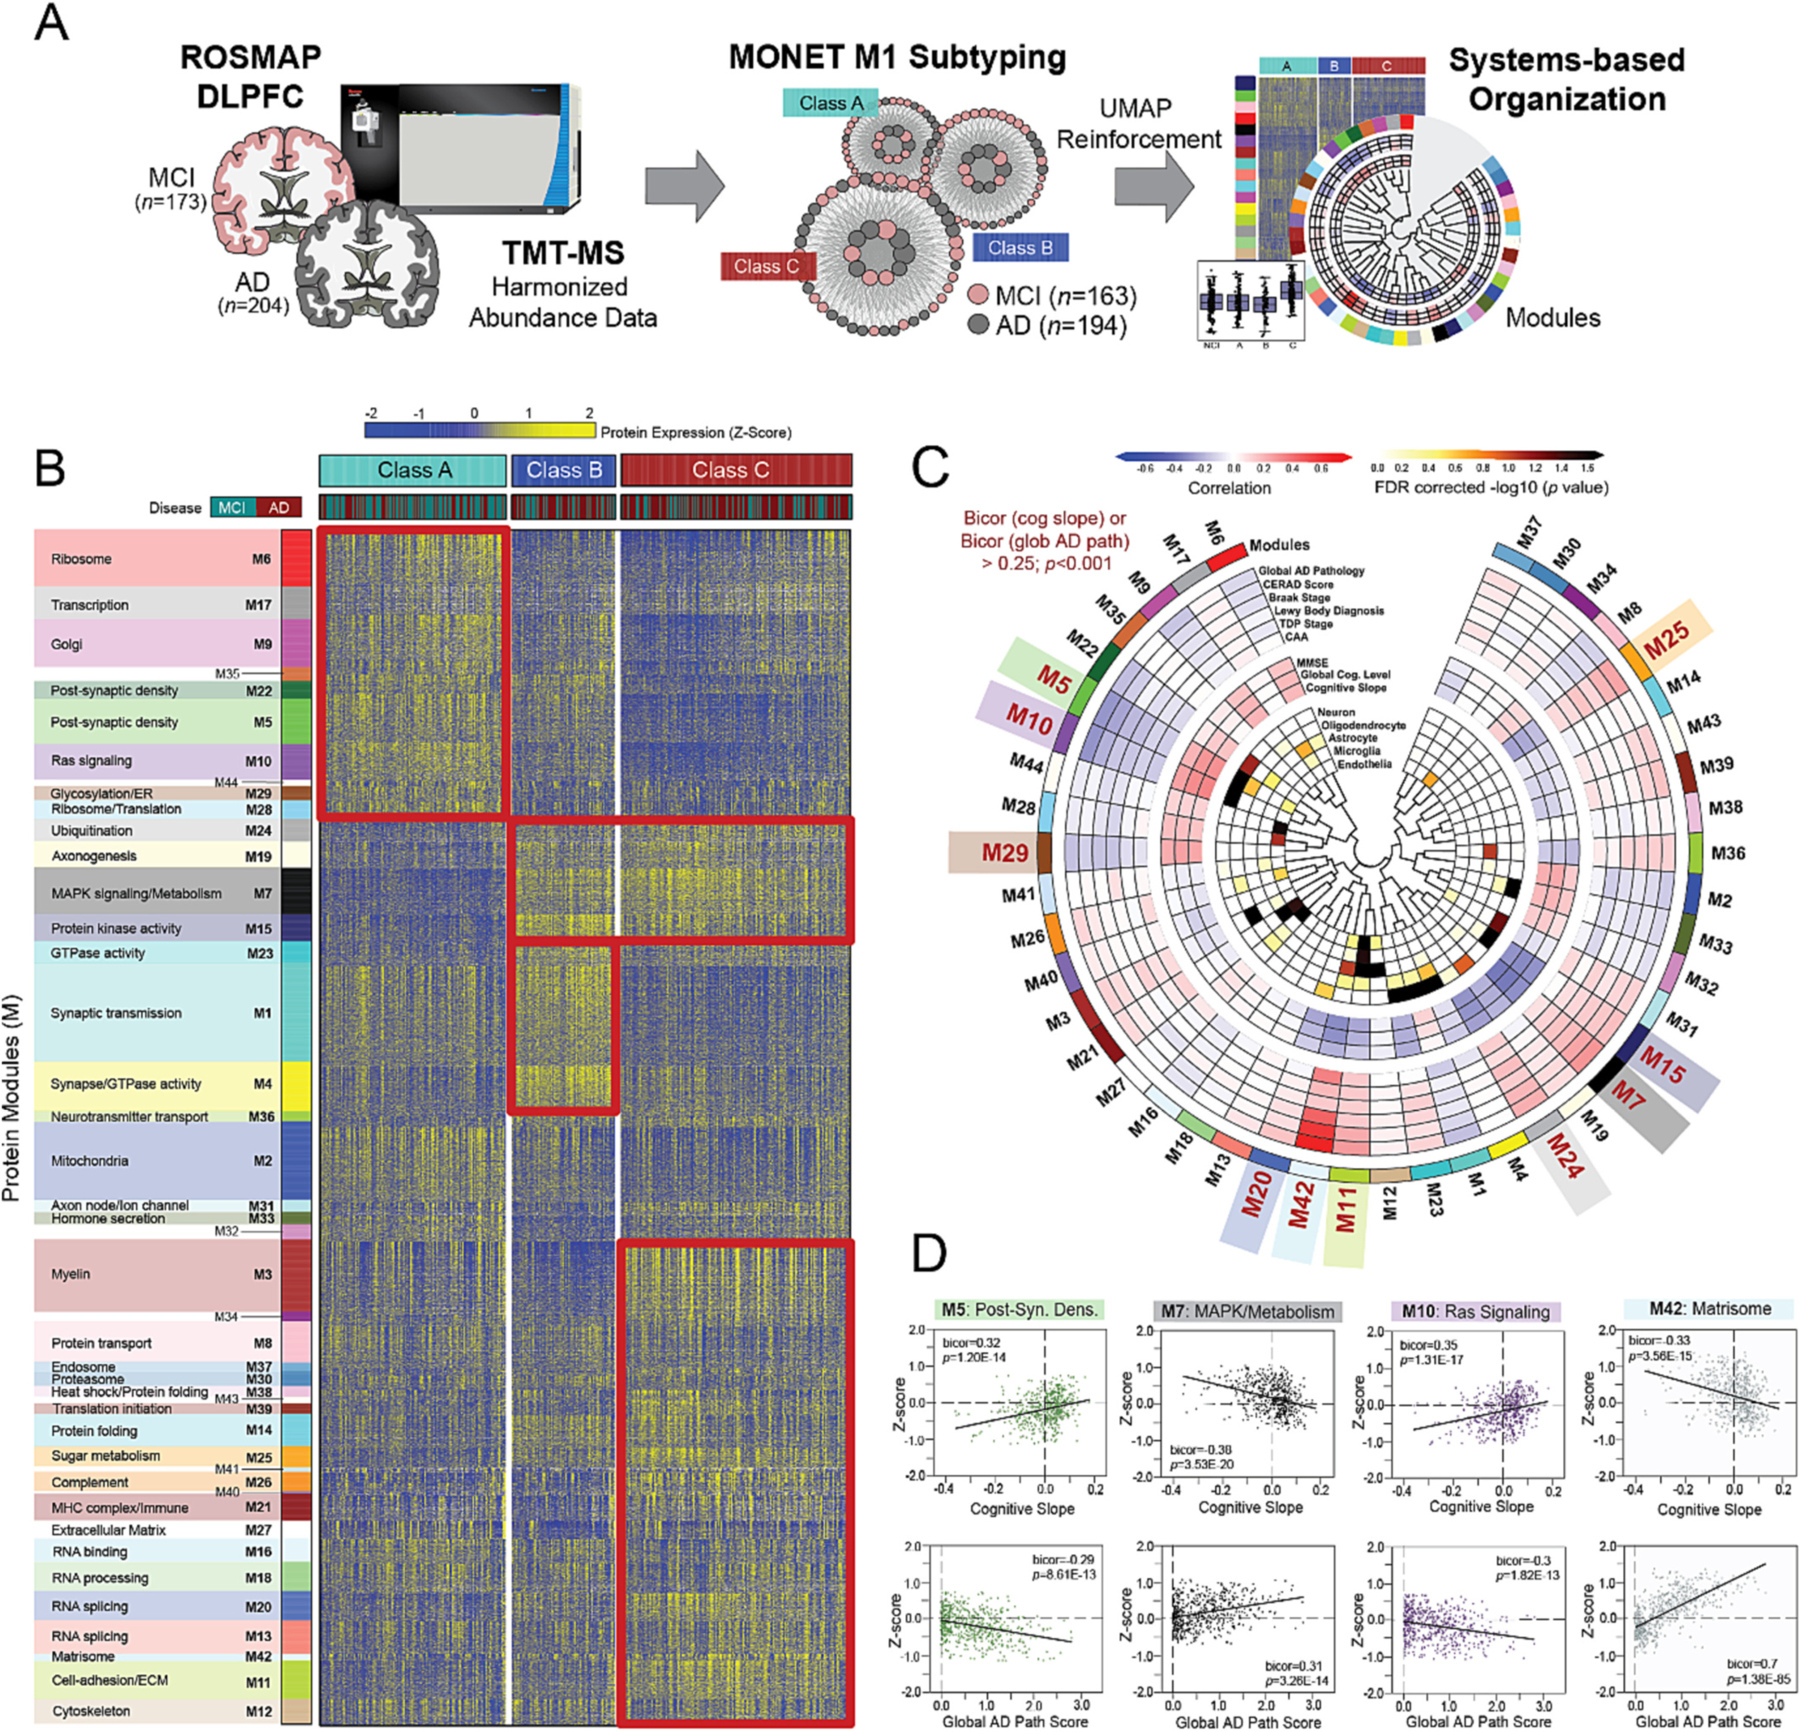
Fig. 3. MONET M1 yields three disease-relevant proteomic classes of cognitive impairment.

(A) Study approach for the unbiased subtyping analysis of ROSMAP MCI and AD cases. (B) Heat map of protein expression across the three proteomic classes generated by MONET M1 analysis. Classes were termed A (n = 128), B (n = 71), and C (n = 158) and each featured a mixture of MCI and AD cases. To provide biological context to the proteomic differences across classes, proteins were organized by modules (M) of co-expression informed by prior AD network analyses. Red boxes highlight modules with relatively elevated levels (yellow shading) in select classes. (C) Diagram depicting the associations of each module to cell type and ROSMAP clinicopathological traits. Modules bolded in red (M5, M10, M29, M20, M42, M11, M24, M7, M15, M25) demonstrated exceptionally strong correlations to cognitive slope and/or global AD pathology (bicor>0.25; p < 0.001). (D) Correlation plots of module abundance (z-score) to cognitive slope or global AD pathology across all analyzed cases (n = 610) for select modules with remarkably strong clinicopathological correlations. M5 and M10 demonstrated highly significant positive correlations to cognitive slope and negative correlations to global AD pathology. In contrast, M7 and M42 were negatively correlated to cognitive slope and positively correlated to global AD pathology. Bicor correlation coefficients with associated p values are shown for each correlation plot. Abbreviations: DLPFC, Dorsolateral Prefrontal Cortex; MCI, Mild Cognitive Impairment; AD, Alzheimer’s Disease; TMT-MS, Tandem Mass Tag Mass Spectrometry; FDR, False Discovery Rate; Post-Syn Dens, Post-Synaptic Density. (For interpretation of the references to color in this figure legend, the reader is referred to the web version of this article.)
