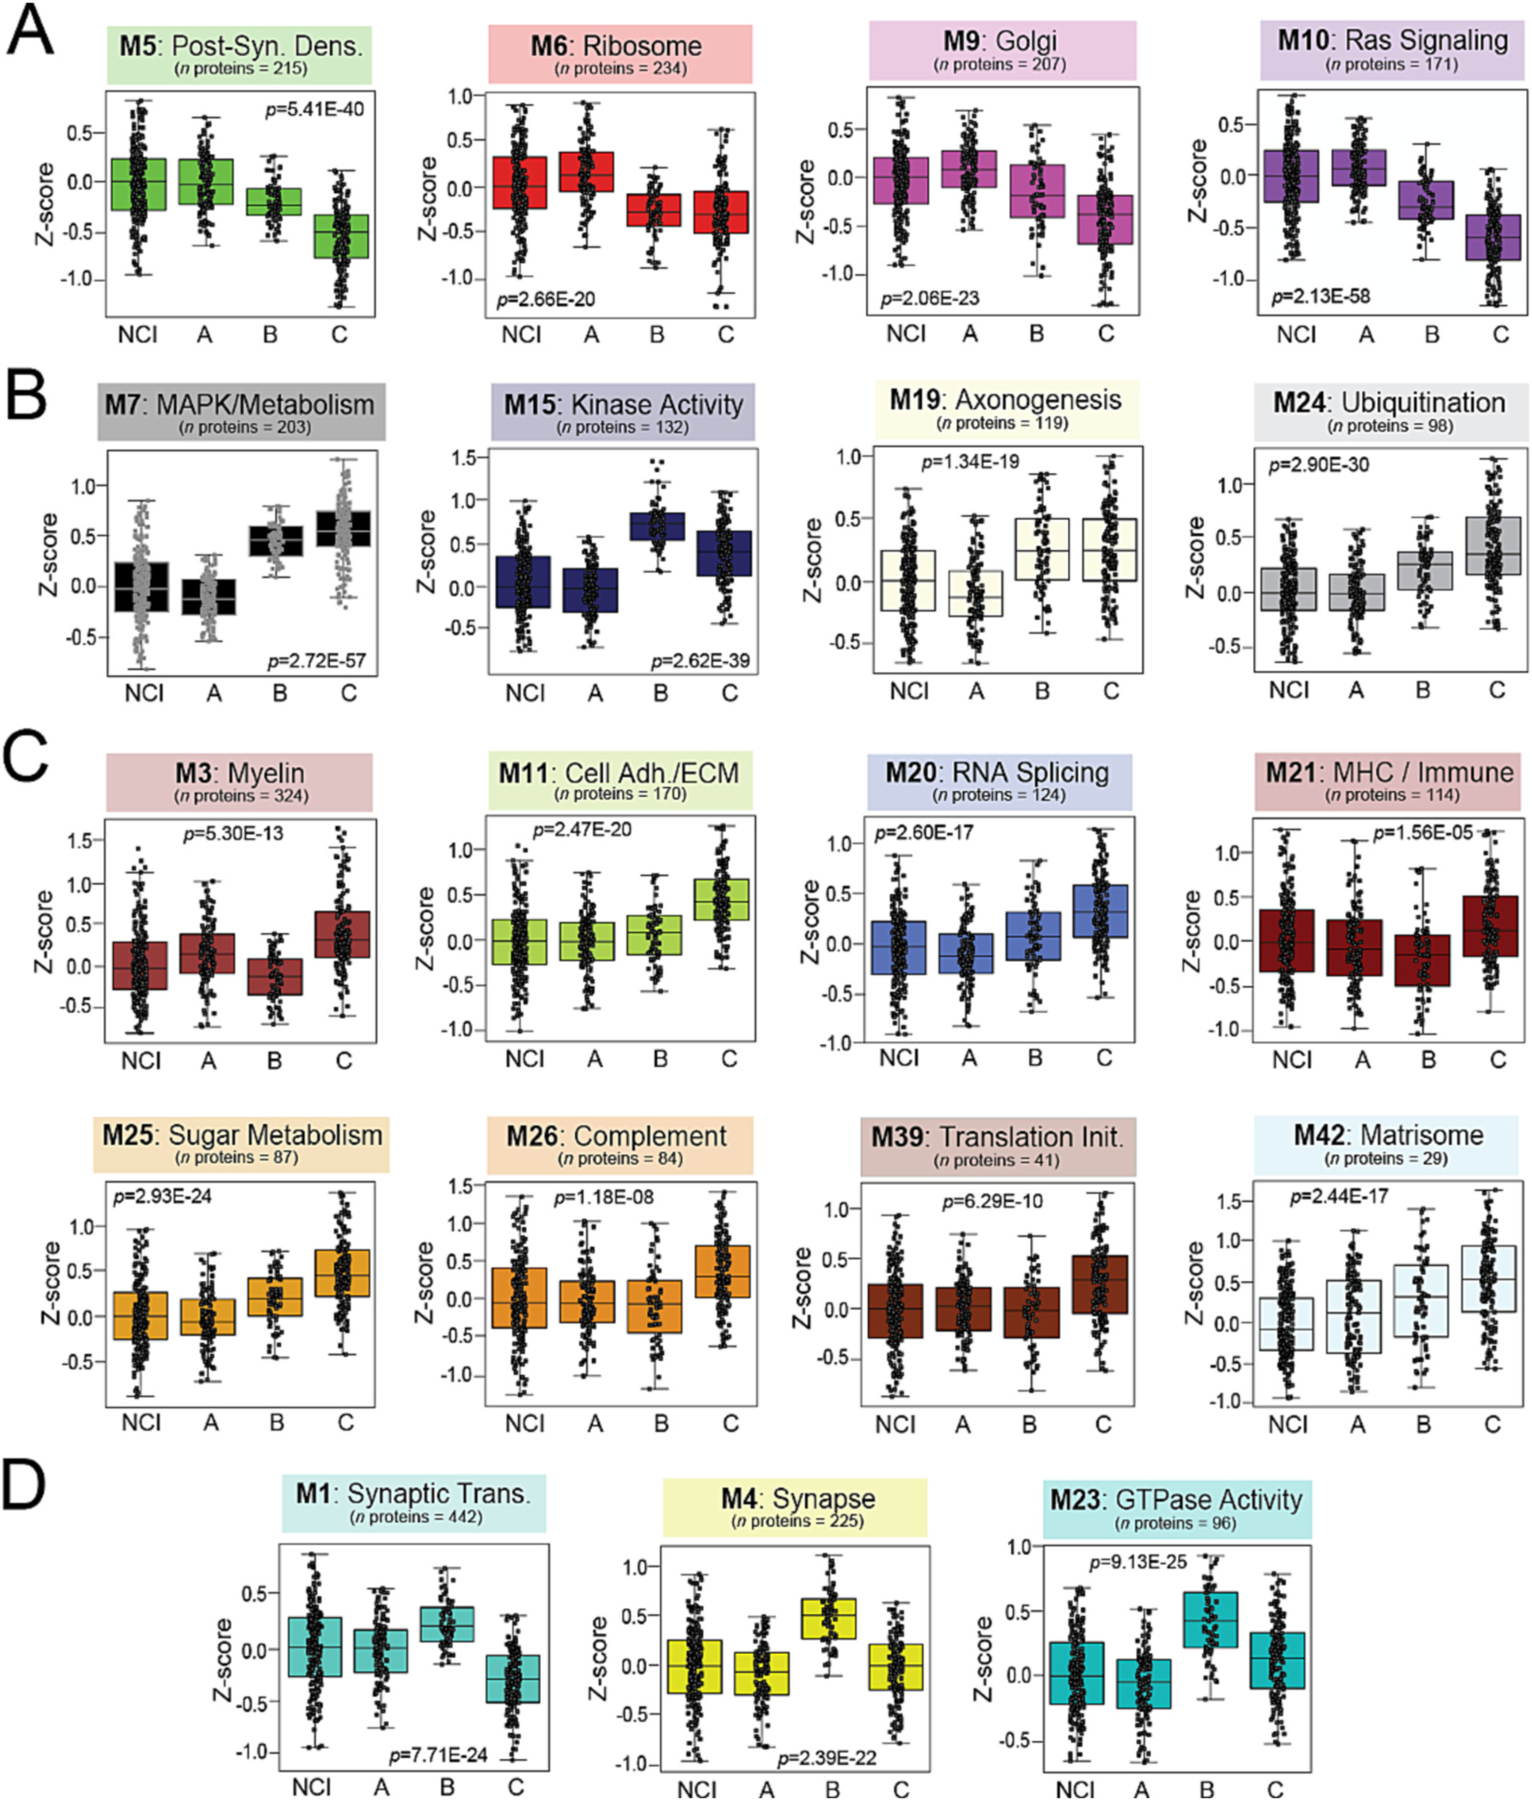
Fig. 4. Module abundances highlight class differences across a diverse range of biological ontologies.

Abundance levels (z-score) of select modules across NCI cases and the three proteomic classes. ANOVA p values are provided for each abundance plot. All modules depicted were significantly altered (p < 0.001) across the four groups. Box plots represent the median and 25th and 75th percentiles, while data points up to 1.5 times the interquartile range from the box hinge define the extent of error bar whiskers. Modules relatively increased in NCI and Class A included M5, M6, M9, and M10, corresponding to post-synaptic density, ribosome, Golgi, and Ras signaling proteins, respectively (A). Kinase-associated M7 and M15 were among modules significantly decreased in NCI and Class A compared to the other two classes (B). Numerous modules were uniquely increased in Class C, most notably several linked to glial-mediated processes (M3, M11, M21, M26, M42) (C). Several synaptic modules (M1, M4, M23) were increased in Class B relative to all other cases (D). Abbreviations: NCI, No Cognitive Impairment; MCI, Mild Cognitive Impairment; AD, Alzheimer’s Disease; Cell Adh / ECM, Cell Adhesion / Extracellular Matrix; Translation Init, Translation Initiation; MHC, Major Histocompatibility Complex; Synaptic Trans, Synaptic Transmission.
