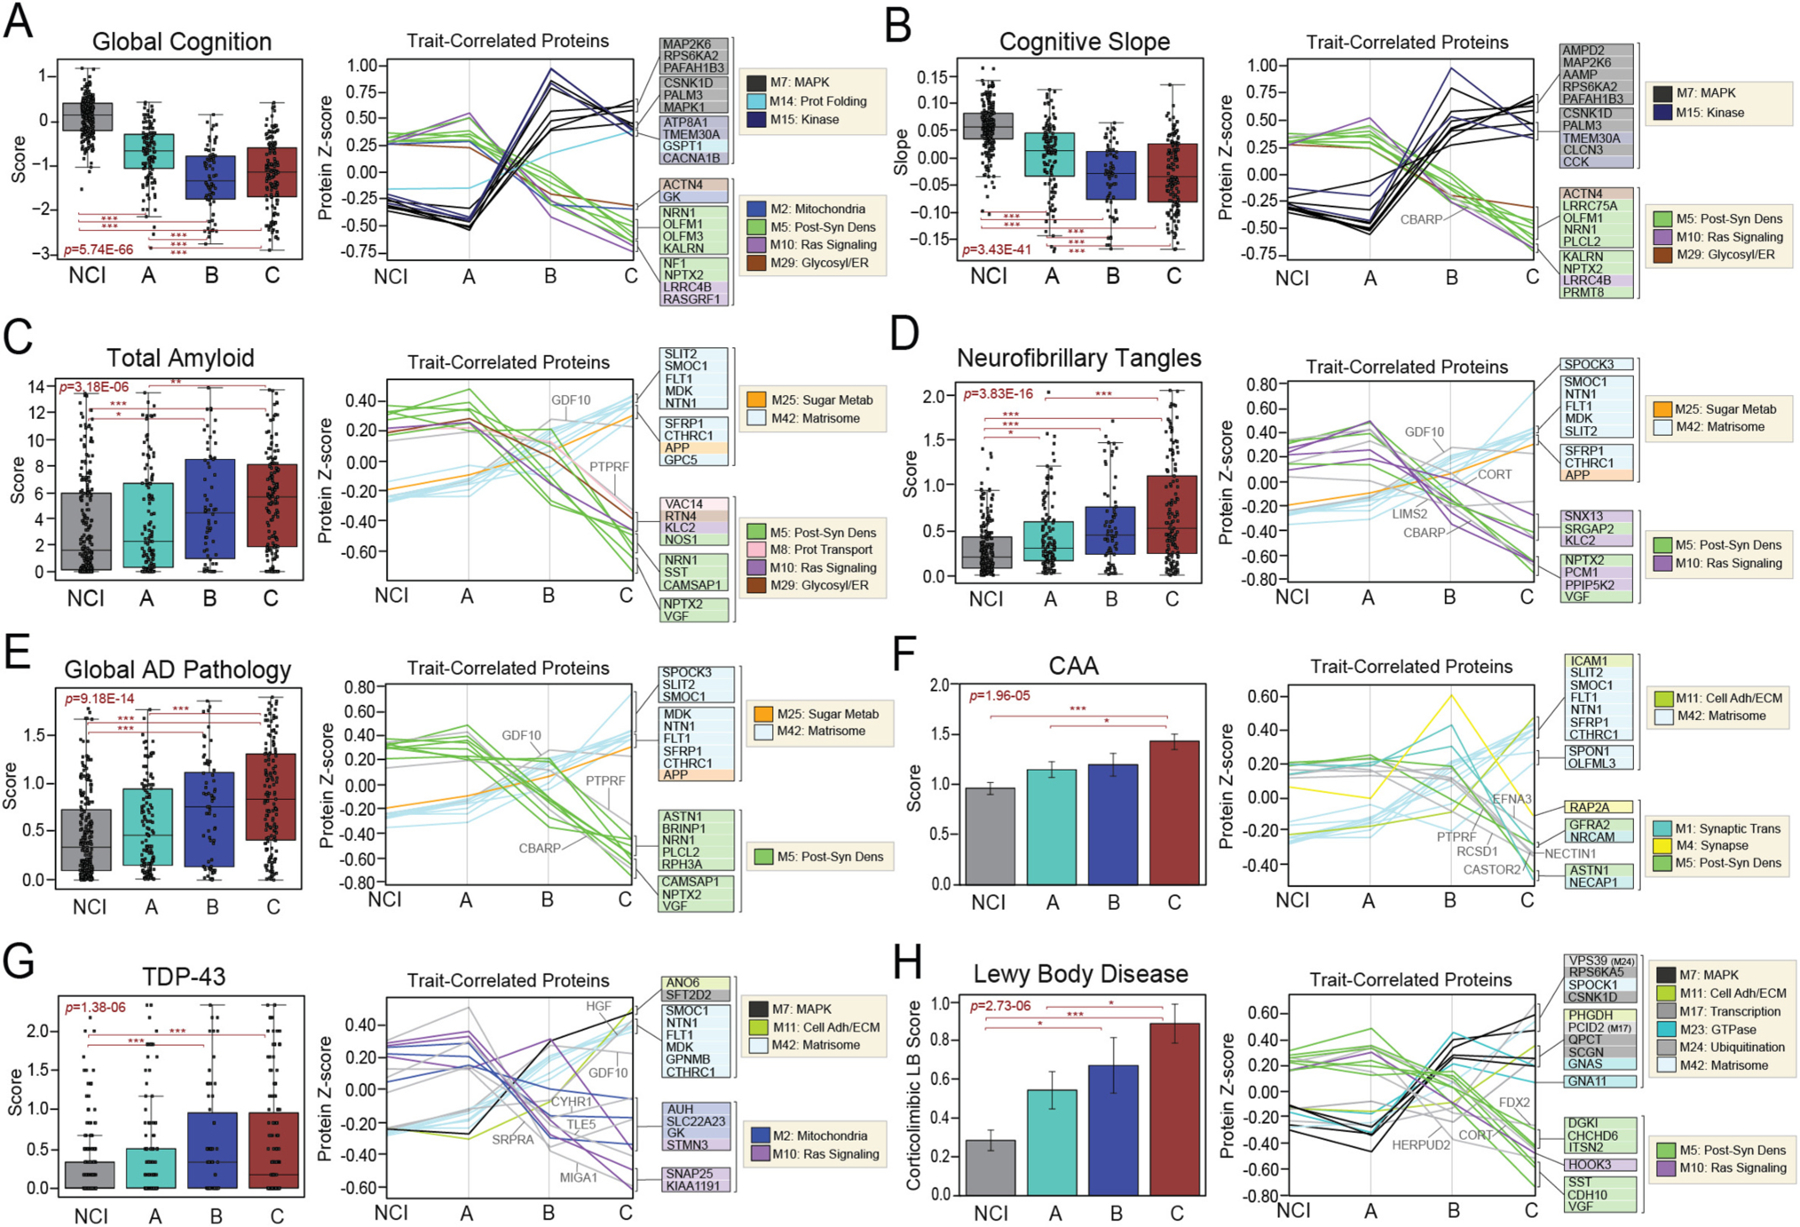
Fig. 6. Classes demonstrate different cognitive and pathological features.

Cognitive (A-B) and neuropathological (C-H) characteristics were compared across NCI cases and the three proteomic classes. For each trait, two plots are provided. The first depicts the average scores of each trait across the four groups. The ANOVA p value across groups is provided with asterisks indicating statistically significant Tukey post hoc pairwise comparisons (*, p < 0.05; **, p < 0.01; ***, p < 0.001). Box plots represent the median and 25th and 75th percentiles, while data points up to 1.5 times the interquartile range from the box hinge define the extent of error bar whiskers. The second plot in each panel showcases the abundance levels (z-scores) across groups of individual proteins highly correlated to that particular trait. The z-scores of the top 10 positively trait-correlated and top 10 negatively trait-correlated proteins are shown. Proteins are shaded according to color of module membership. Proteins without a module assignment are not shaded. Abbreviations: CAA, Cerebral Amyloid Angiopathy; TDP-43, TAR DNA-Binding Protein 43; Prot Folding, Protein Folding; Post-Syn Dens, Post-synaptic Density; Glycosyl, Glycosylation; ER, Endoplasmic Reticulum; Prot Transport, Protein Transport; Adh, Adhesion; ECM, Extracellular Matrix; Metab, Metabolism.
