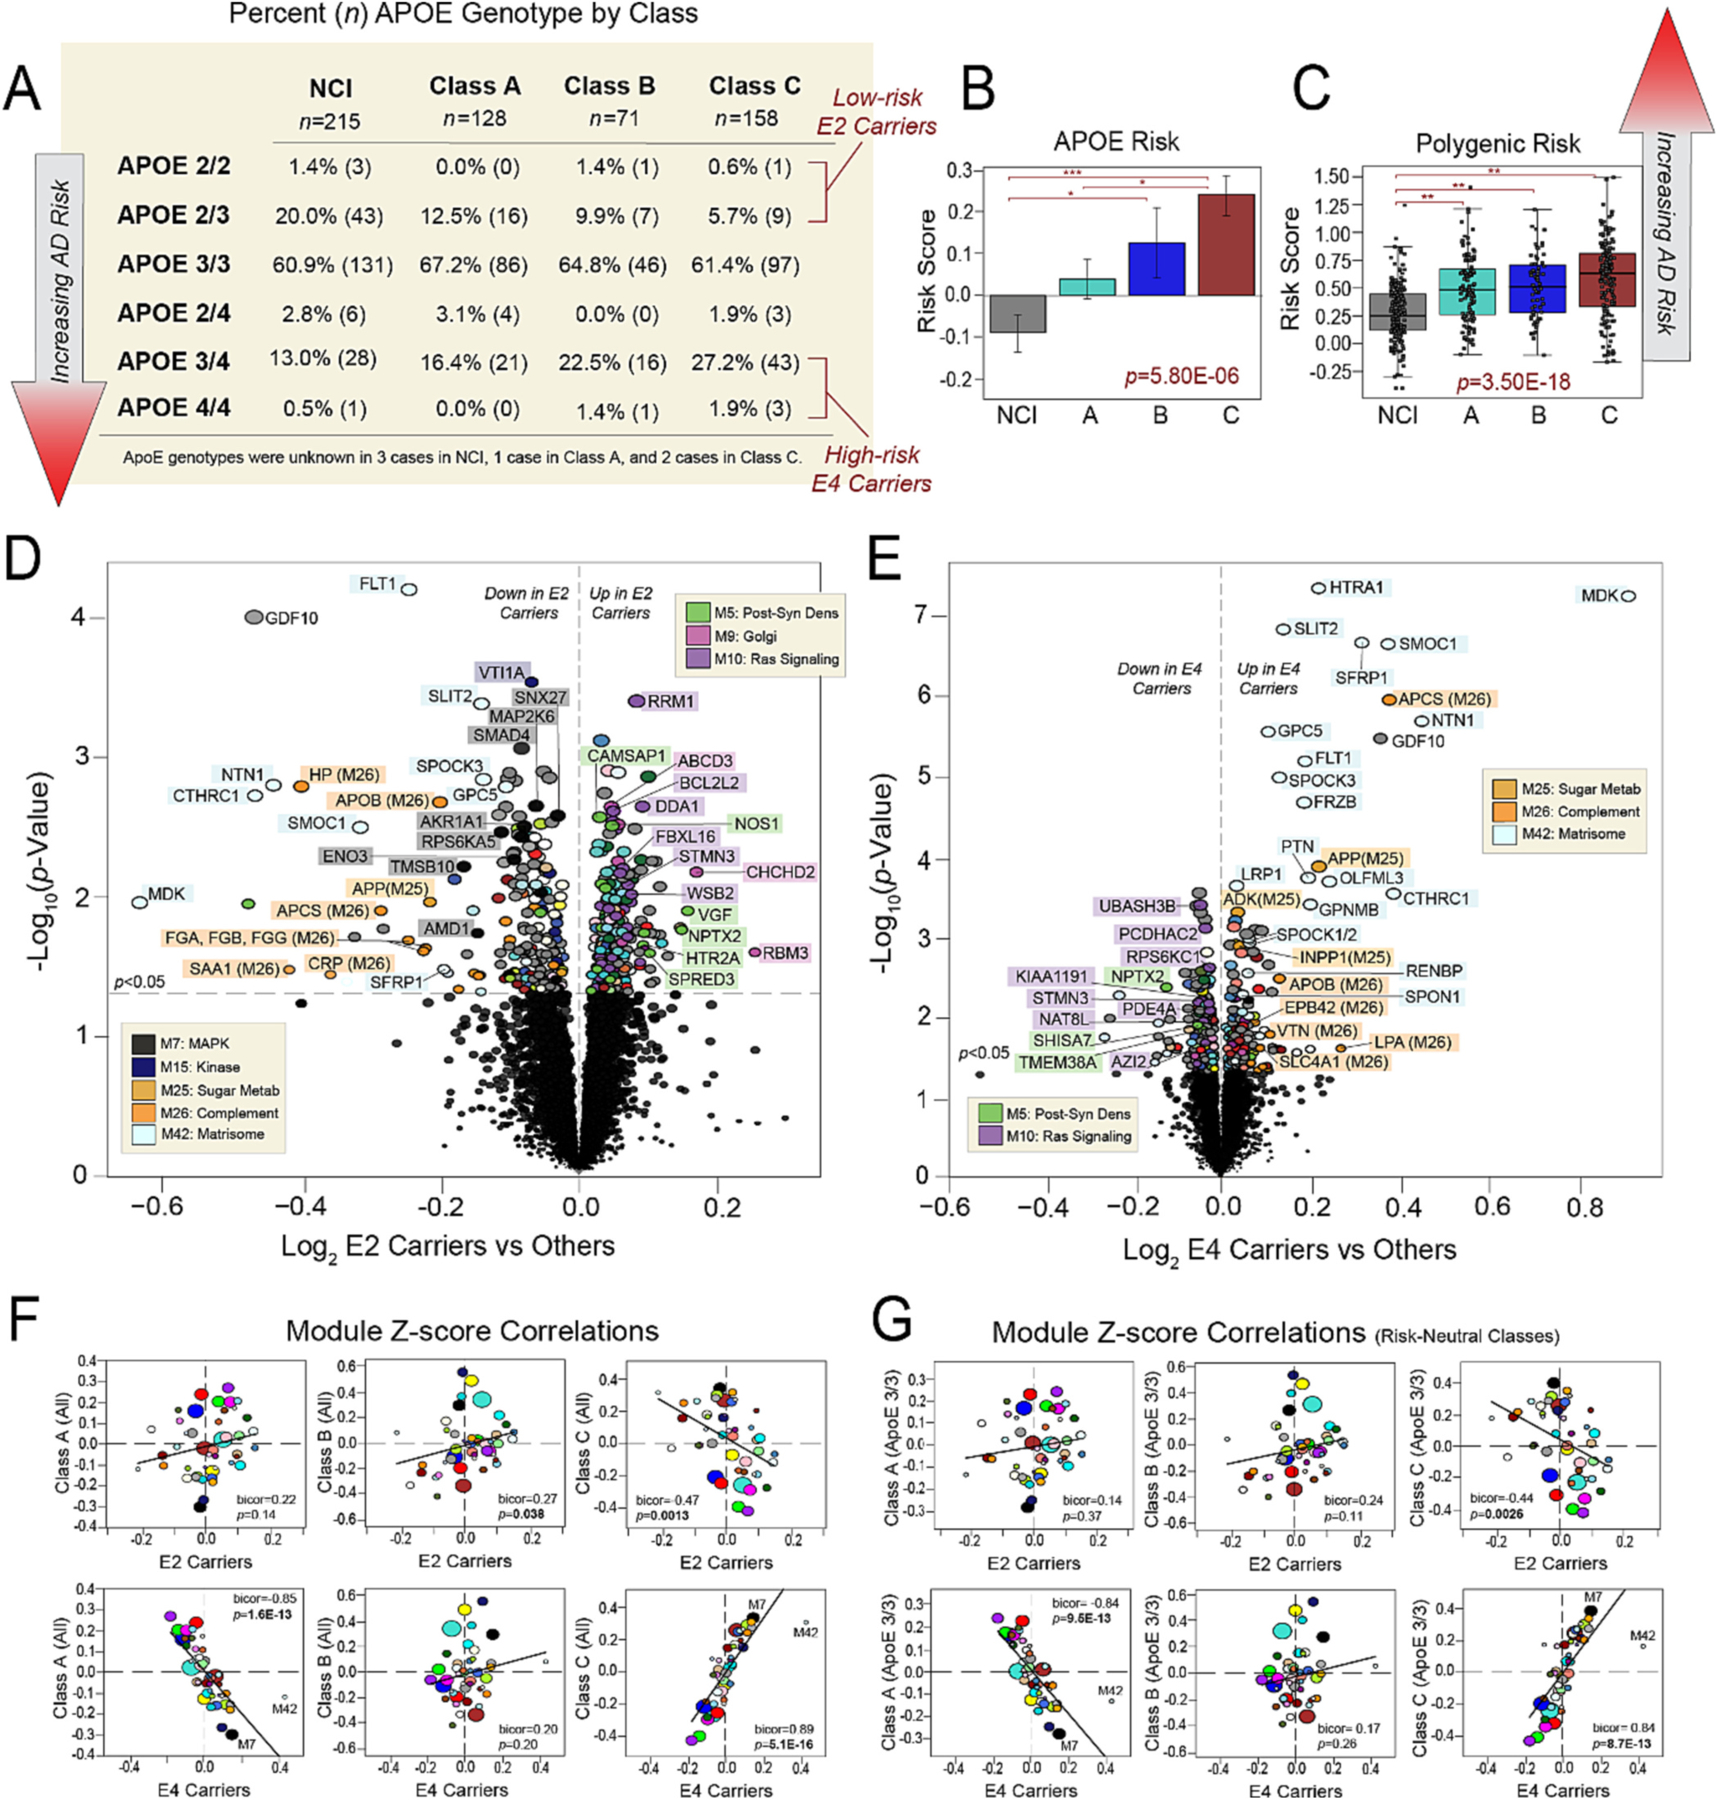
Fig. 7. Class C protein expression strongly mirrors that of ApoE4 carriers.

(A) Table showcasing the percentages of different APOE genotypes within NCI and each class. The corresponding number of cases with each genotype is also provided in parentheses. Cases considered low-risk E2 carriers or high-risk E4 carriers are indicated. Class C comprised twice as many high-risk E4 carriers compared to Classes A and B. (B) Comparison of average APOE risk scores across NCI and the three proteomic classes. Individual risk scores for each case were calculated by assigning −1 points to each E2 allele, 0 points to each E3 allele, and +1 points to each E4 allele. The ANOVA p value across groups is provided with asterisks indicating statistically significant Tukey post hoc pairwise comparisons (*, p < 0.05; **, p < 0.01; ***, p < 0.001). (C) Comparison of polygenic risk scores across NCI and the three proteomic classes. The ANOVA p value across groups is provided with asterisks indicating statistically significant Tukey post hoc pairwise comparisons (*, p < 0.05; **, p < 0.01; ***, p < 0.001). (D-E) Volcano plots displaying the log2 fold change (x-axis) against the t-test-derived -log10 statistical p value (y-axis) for proteins differentially expressed in E2 carriers or E4 carriers when compared to all other cases, excepting those with E2/4 genotypes which were excluded from these analyses. Thus, (D) is a comparison of protein expression in the 34 cases with E2/2 and E2/3 genotypes to the 313 cases with E3/3, E3/4, and E4/4 genotypes, while (E) is a comparison of protein expression in the 84 cases with E3/4 and E4/4 genotypes to the 263 cases with E2/2, E2/3, and E3/3 genotypes. Proteins are shaded according to color of module membership. (F-G) Correlation plots of module abundance levels (z-scores) in E2 (E2/2, E2/3) or E4 (E3/4, E4/4) carriers to those of each proteomic class. Class-specific z-scores in (F) reflect all members of each class, while those in (G) reflect only individuals with E3/3 genotypes in each class. Bicor correlation coefficients with associated p values are shown for each correlation plot. Abbreviations: Post-Syn Dens, Post-Synaptic Density; Metab, Metabolism.
