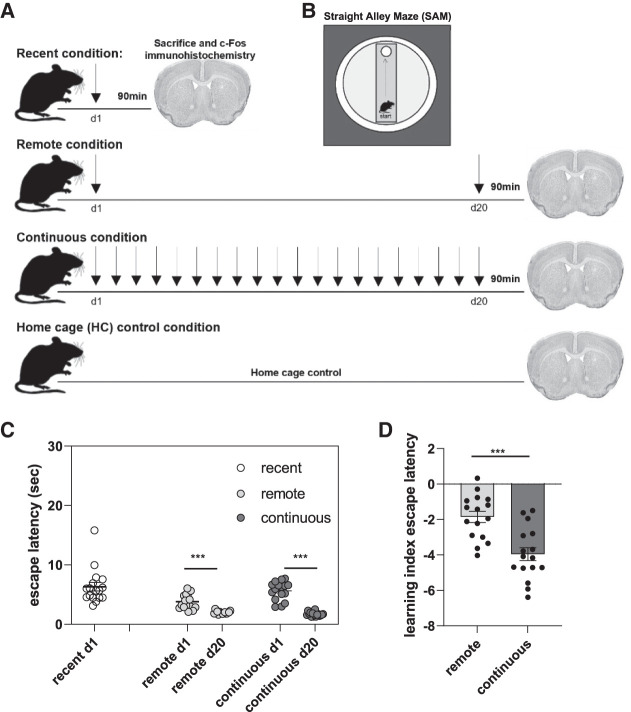
Figure 1.
Study design and escape latencies. (A) Schematic of the study design. Each arrow indicates a training day (five trials/day). (B) Schematic of the straight alley maze (SAM) apparatus. (C) Escape latency (in seconds) on day 1 (d1) and day 20 (d20) of SAM training. (D) Learning index (LI) measure of escape latency between day 1 and day 20 of SAM training. The LI was calculated by subtracting day 1 latency values from day 20 values to generate a measure of motor learning over time. Individual data points are presented for each subject within the training conditions. Bars represent the group mean, and error bars represent the standard error of the mean (SEM). (***) P < 0.001.

