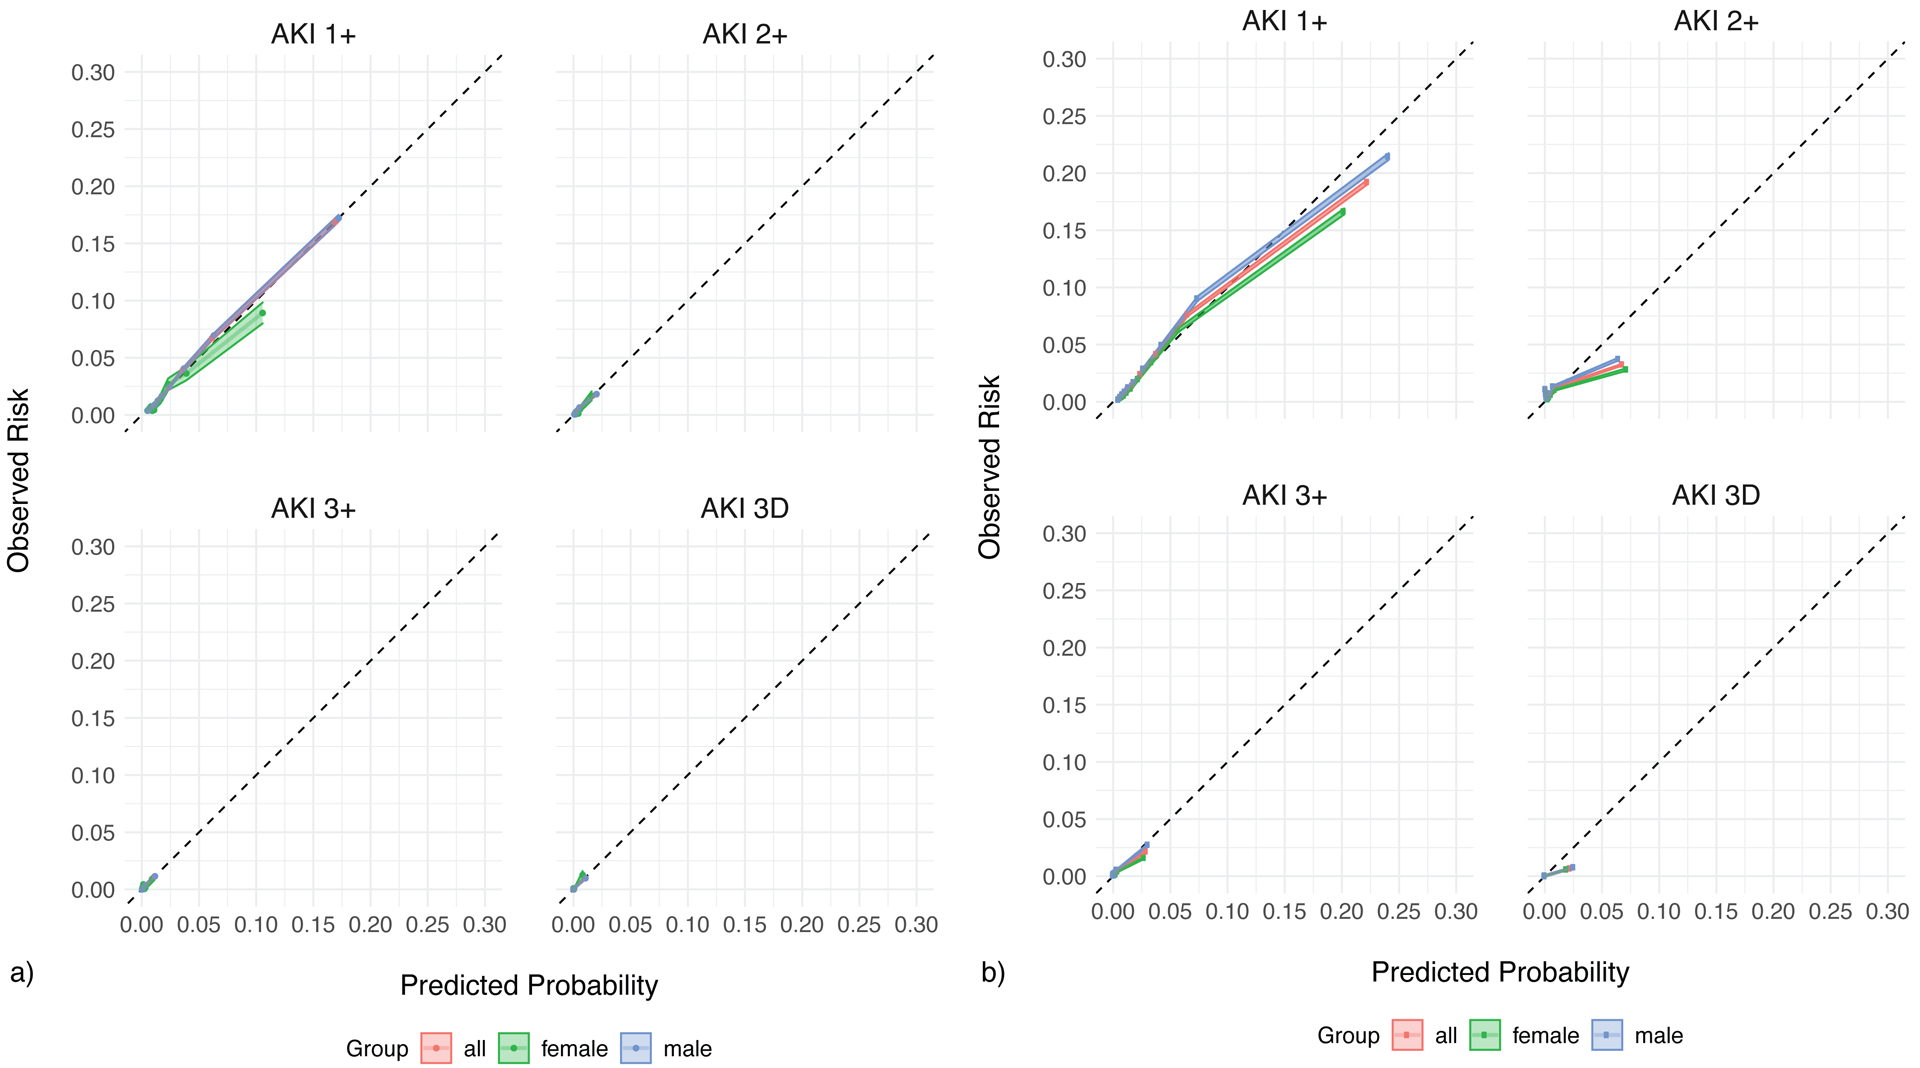
Extended Figure 2. Calibration of the original VA model a) VA test set b) UM test set.

The calibration of the original model on the a) VA test set and b) UM test set. The predicted probabilities (deciles) are plotted against the observed probabilities with 95% confidence intervals. The diagonal line demonstrates the ideal calibration. The model calibration is examined for all patients (red), females only (green), and males only (blue).
