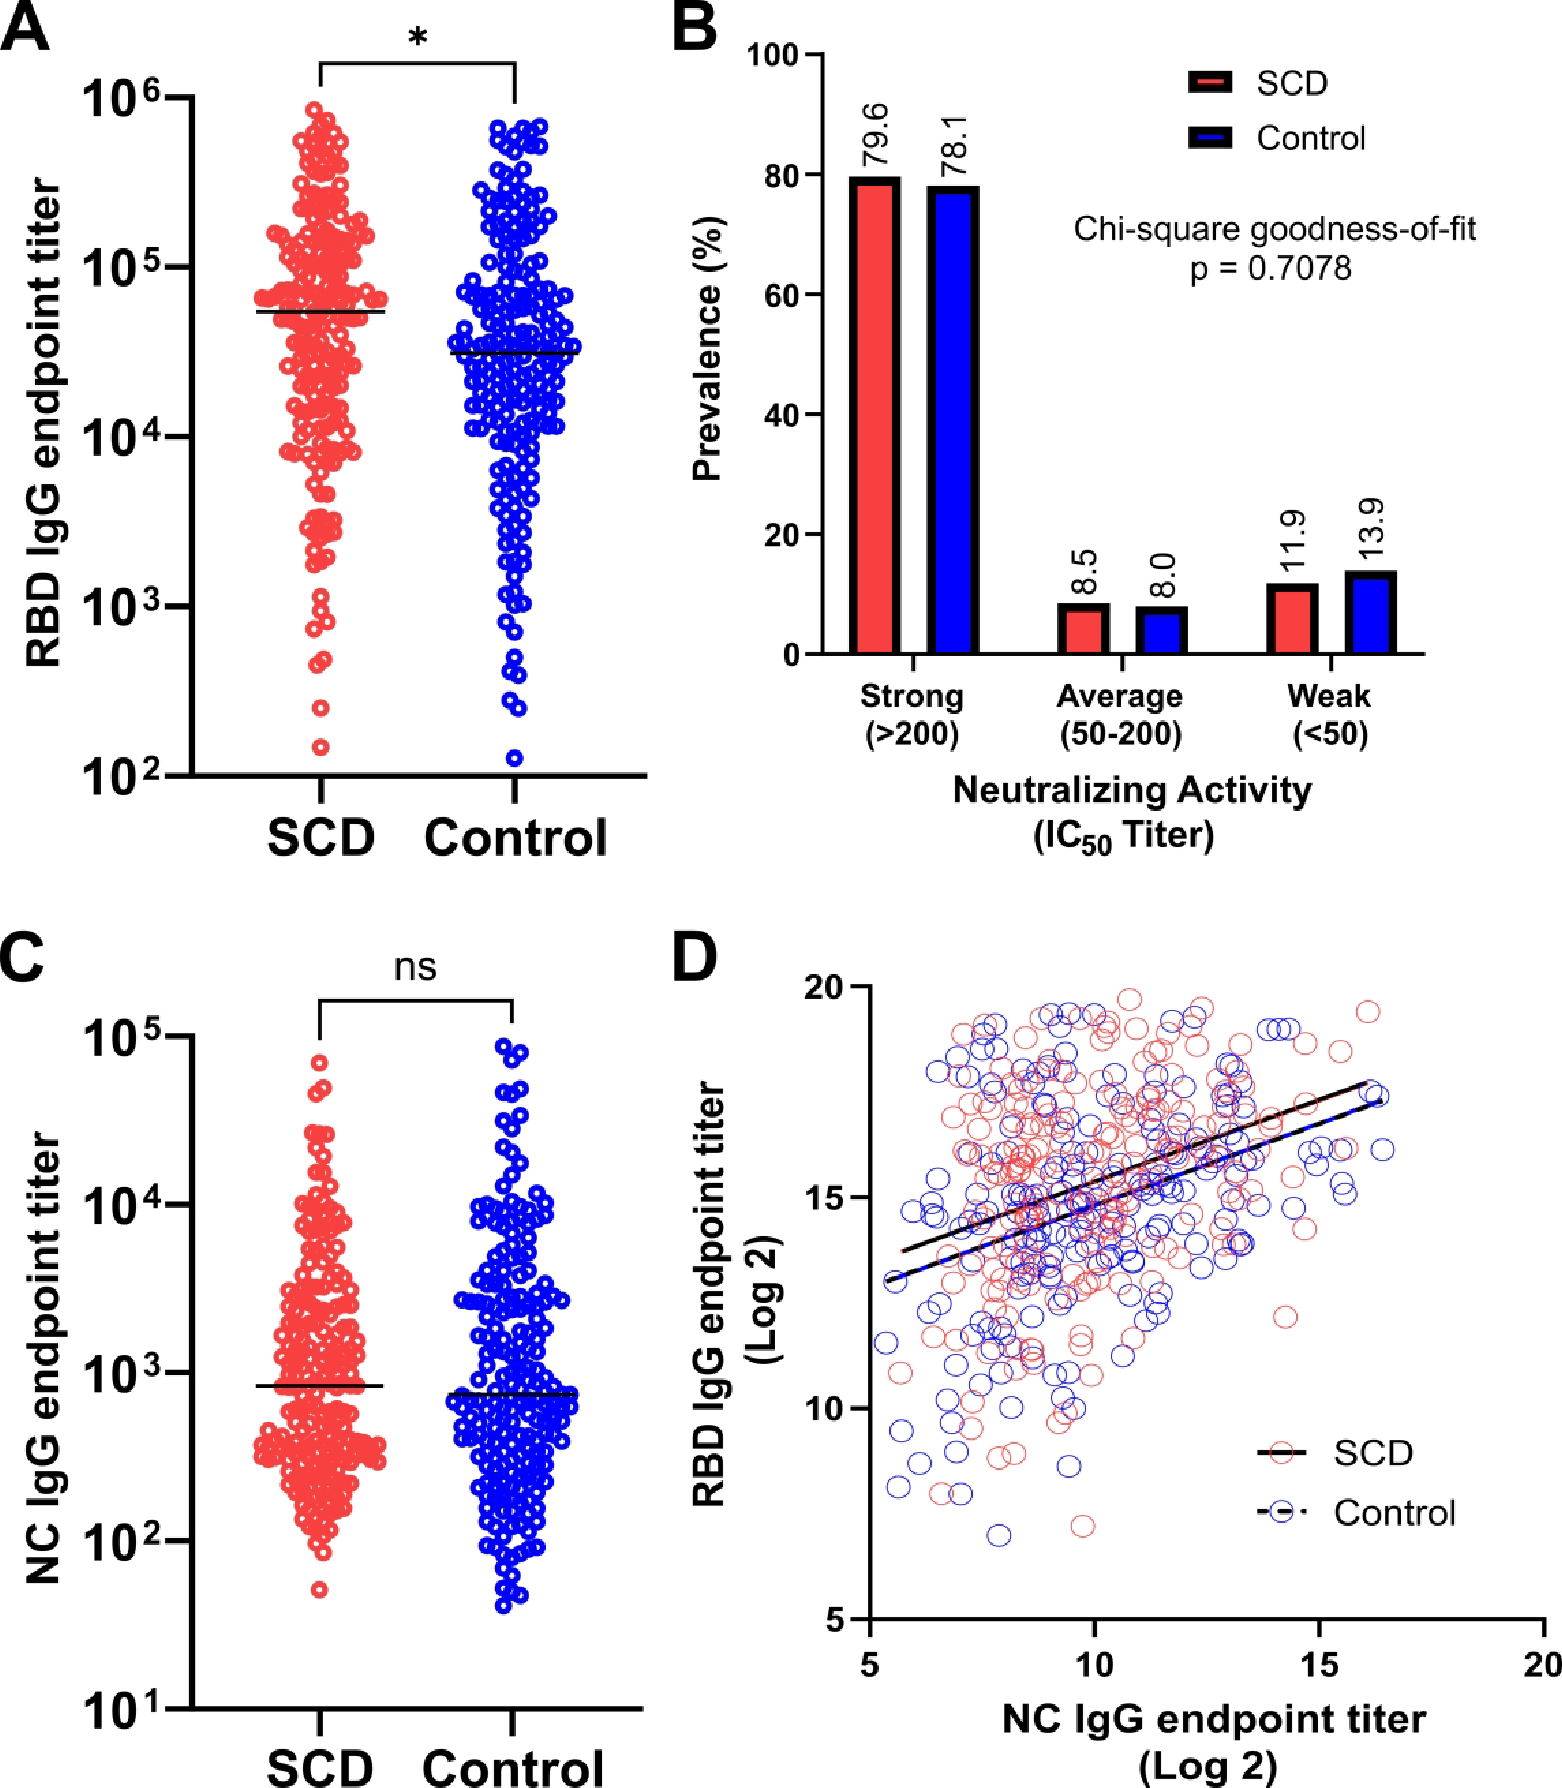
Figure 1.

Comparison of COVID-19 vaccine immune response in SCD (red) and matched non-SCD controls (blue). (A) SARS-CoV-2 RBD-specific IgG endpoint titer. Lines indicate median. (B) Prevalence of neutralizing activity, by strength. (C) SARS-CoV-2 NC-specific IgG endpoint titer. Lines indicate median. (D) Simple linear regression of NC- and RBD-specific IgG endpoint titer after log2 transformation with best-fit lines for SCD (solid) and controls (dashed). Statistical difference measured by Mann-Whitney test, chi-square goodness-of-fit test or ANCOVA test as applicable. * = P ≤ 0.05, ns = P > 0.05. IC50, 50% inhibitory concentration; NC, nucleocapsid; RBD, receptor binding domain; SCD, sickle cell disease.
