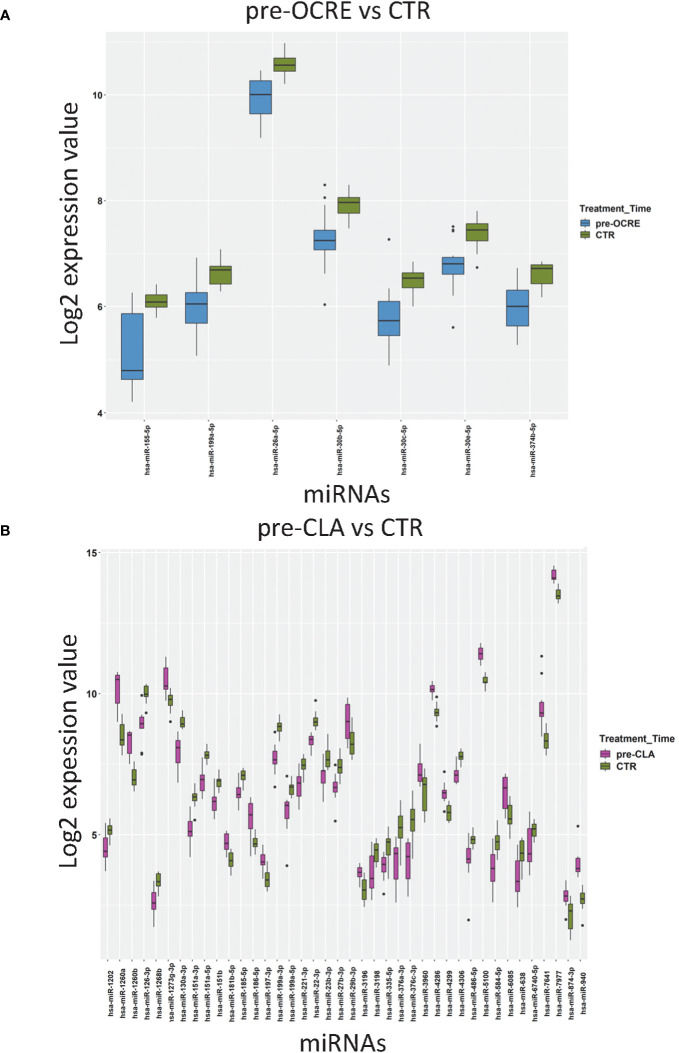
Figure 1.
Relapsing–remitting multiple sclerosis patients, clinically selected for cladribine (CLA) or ocrelizumab (OCRE) treatment, display different miRNA profiles. (A) Pre-OCRE (n = 15) vs. CTRs (n = 15) comparison. (B) Pre-CLA (n = 10) vs. CTRs (n = 15) comparison. Log2 median normalized values of differentially expressed miRNAs were selected using the following thresholds: R limma test false discovery rate <0.05 + linear |fold change| >1.5. The boxes correspond to median ± interquartile range, and the black dots are outliers.

