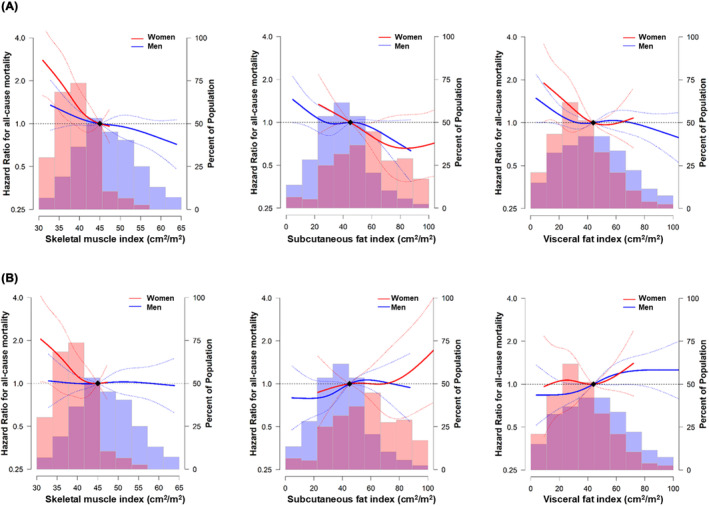
Figure 4.

Multivariable‐adjusted hazard ratios for all‐cause death by skeletal muscle index, subcutaneous fat index, and visceral fat index in men and women. The curves represent the adjusted hazard ratios (solid line) and 95% confidence intervals (dashed lines) for all‐cause death based on restricted cubic splines for skeletal muscle (left row), subcutaneous fat (middle row), and visceral fat indices (right row) with knots at the 5th, 35th, 65th, and 95th percentiles of their sample distributions. The distribution of each body composition was visually represented using blue histogram for men and red histogram for women. The reference value (diamond dots) is set to the 50th percentile. (A) Model 1: Adjusted for age, sex, smoking status, ECOG PS, CCI, NLR, histology, PD‐L1 expression status, treatment agents, and line of treatment. (B) Model 2BMI: Additionally adjusted for BMI. BMI, body mass index; CCI, Charlson co‐morbidity index; ECOG PS, Eastern Cooperative Oncology Group Performance Status; NLR, blood neutrophil‐to‐lymphocyte ratio; SFI, subcutaneous fat index; SMI, skeletal muscle index; VFI, visceral fat index.
