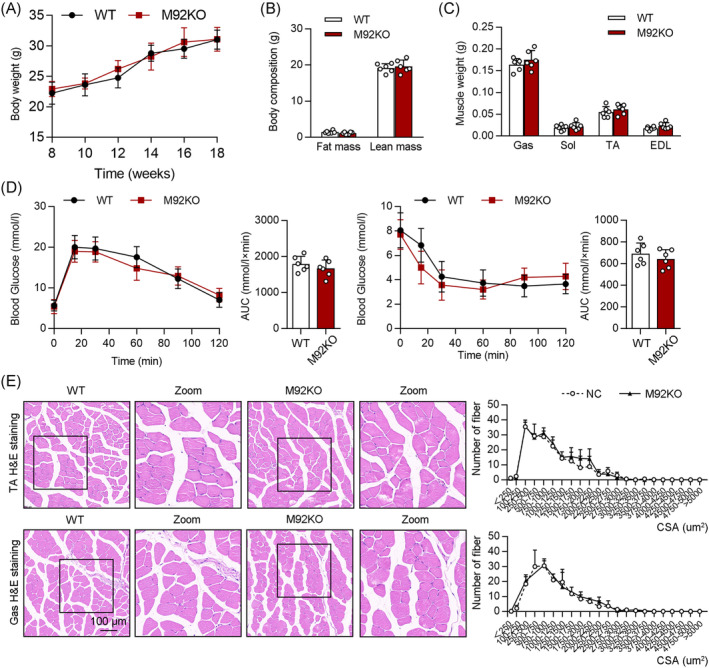
Figure 2.

Deficiency of miR‐92b shows normal systemic metabolism. (A) Body weight (BW) changes over time of WT and miR‐92b knockout (M92KO) mice (n = 6). (B) Body mass measured by MRI in 18‐week‐old mice (n = 6). (C) Weights of four muscle types, Gas, Sol, TA, and digitorum longus (EDL) from WT or M92KO mice (n = 6). (D) Blood glucose during GTT (left panel) and ITT (right panel) (n = 6). (E) Histology of TA (the upper panel) and Gas (the bottom panel) muscles, as determined by H&E staining in both the WT or M92KO mice, and quantitative analysis of findings (n = 6). All results are expressed as means ± SD. *P < 0.05, **P < 0.01, ***P < 0.001, by unpaired Student's t test.
