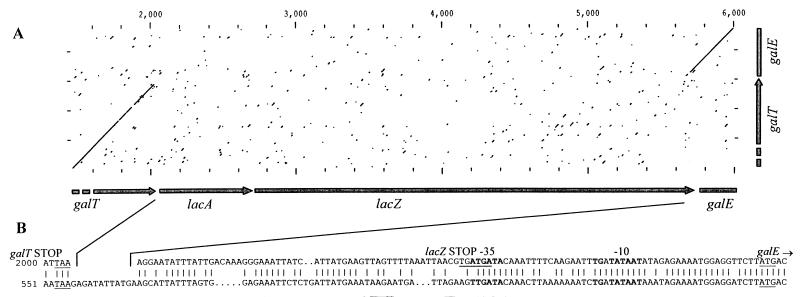
FIG. 5.
(A) Dot plot presentation of nucleotide sequence comparisons between the galT-lacA-lacZ-galE of L. lactis NCDO2054 (horizontal axis) and the 5′ end of galT and 3′ end of galE of L. lactis LM0230 (vertical axis). Numbers above the dot plot indicate nucleotide positions. (B) Nucleotide sequences of the galT-lacA and lacZ-galE intergenic regions of L. lactis NCDO2054 (upper sequence) aligned with the galT-galE intergenic region of L. lactis LM0230 (lower sequence). Identical nucleotides (|) are indicated. The genes encoded by the DNA are shown above the sequence. The translational start and stop sequences are underlined, and potential promoter sequences for galE are indicated in boldface.

