FIGURE 3.

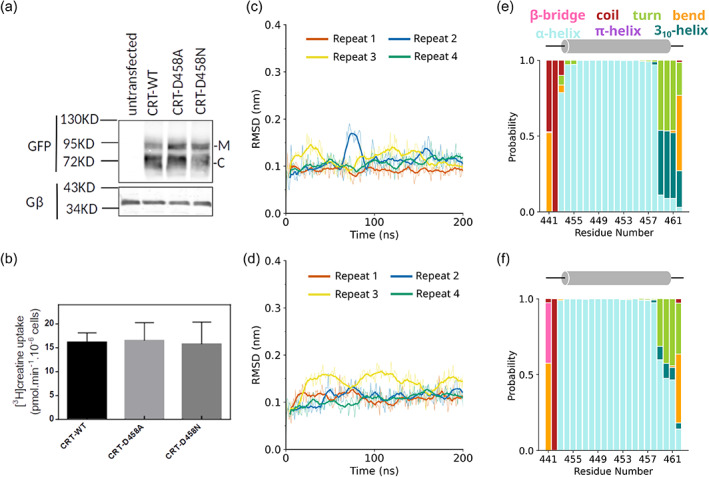
Experimental and computational evidence to support the neutral protonation state of D458. (a) Immunoblotting for wild‐type CRT1 (WT), CRT1‐D458A (D458A), and CRT1‐D458N (D458N). Aliquots (10 μg) of lysates, which had been prepared from untransfected HEK293 cells and HEK293 cells transiently expressing YFP‐tagged wild type and mutant transporters, were resolved by denaturing electrophoresis. After transfer to nitrocellulose membranes, the immunoreactive bands were detected with an antibody directed against green fluorescent protein (GFP) (upper blot) or the G protein β‐subunits (as a loading control, lower blot). M and C indicate the positions of the (ER‐resident) core‐glycosylated species and the transporters harboring mature glycan moieties, respectively. (b) Substrate uptake velocity of wild‐type CRT1 (WT), CRT1‐D458A (D458A), and CRT1‐D458N (D458N). HEK293 cells were transfected with plasmids encoding YFP‐tagged wild type and mutant versions of CRT1. After 24 h, cells (2 × 10⁵/well) were seeded onto poly‐D‐lysine‐coated 48‐well plates and allowed to adhere overnight. Subsequently, the uptake reaction was initiated by adding 3 μM [3H]creatine and carried out for 6 min as described in Section 5. Non‐specific uptake was determined in the presence of 300 μM β‐guanidinopropionic acid (<5% of total uptake) and was subtracted. Data are means ± standard deviation (SD) from the three independent experiments carried out in triplicate. (c, d) Root mean square deviation (RMSD) analysis showing the stability of TM9 in the (c) CRT1‐D458A and (d) CRT1‐D458N. The bold lines indicate the running average, with a window of 10 ns applied. (e, f) Bar graph showing the probability of residues 441–462 being in different secondary structural states for (e) CRT1‐D458A and (f) D458N, as defined by the DSSP algorithm (Kabsch & Sander, 1983). The data were averaged over four repeats.
