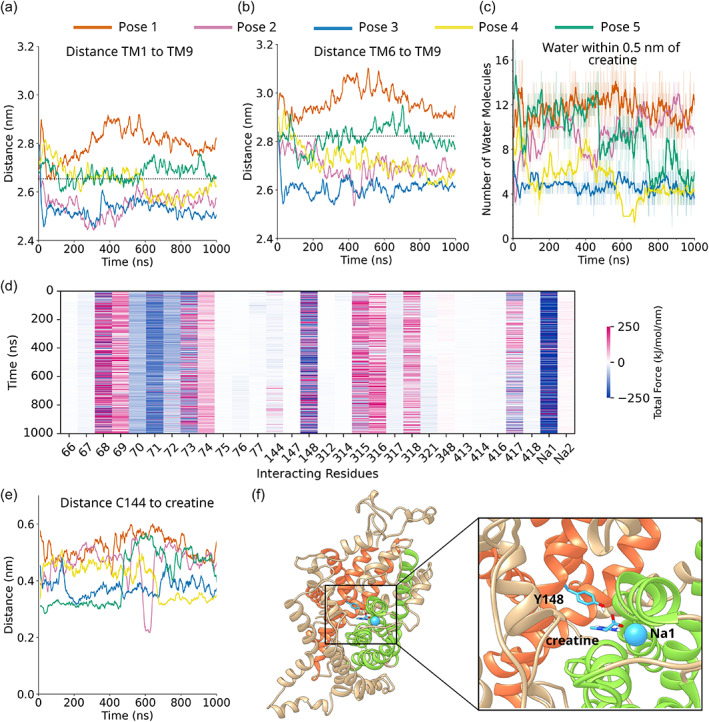
FIGURE 7.

Simulation 4 undergoes a transition toward the occluded state. (a) Distance measurement between the center of mass of residues 72–85 of TM1b and 456–458 of transmembrane helix 9 (TM9). A window average of 10 ns was applied. The dotted line indicates the distance between these helices in the occluded conformation of serotonin transporter (SERT). (b) Distance measurement between the center of mass of residues 303–317 of TM6a and 456–458 of TM9. A window average of 10 ns was applied. The dotted line indicates the distance between these helices in the occluded conformation of SERT. (c) Number of water molecules within 0.5 nm of creatine as a function of time. The bold lines indicate the running average, with a window of 10 ns applied. The thin lines indicate the raw data. (d) Time‐resolved force distribution analysis for simulation 4, the occluding trajectory. The 30 residues which exert the greatest force on creatine are shown and colored according to the total force (electrostatic plus van der Waals) exerted on creatine. (e) Smallest distance between creatine and C144 as a function of time for the five simulations. A window average of 20 ns has been applied. (f) Interaction chain of Y148—creatine—and Na+ in the first sodium ion binding site (Na1). Helices are colored according to whether they are part of the scaffold domain (orange), bundle domain (green), or neither (tan).
