
FIGURE 4.
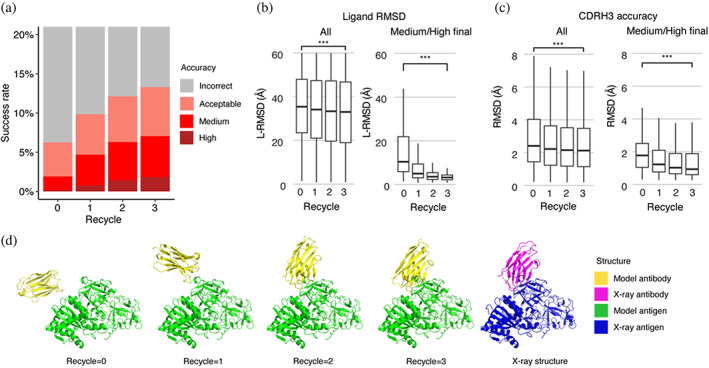
Analysis of antibody–antigen predictions across recycling iterations. (a) The accuracy of antibody–antigen complex predictions across up to three recycling iterations. Complex prediction accuracy across recycling iterations (up to three recycles, denoted by the x‐axis). Success rate is defined as the proportion of predictions of specific level of CAPRI criteria in a total of 25 prediction per complex, 426 complexes total, at the given recycle. Recycle = 0 denotes the state of the prediction before recycling iterations begin. (b) Distribution of the ligand RMSD (L‐RMSD, Å) of antibody–antigen prediction at each recycling iteration (denoted by the x‐axis), of all predictions (25 predictions × 426 complexes, left panel) or a subset of predictions of medium or high CAPRI accuracy at recycle = 3 (106 predictions, right panel). (c) Distribution of the CDRH3 accuracy of antibody–antigen prediction at each recycling iteration (denoted by the x‐axis), of all or a subset of predictions of medium or high CAPRI accuracy at recycle = 3. CDRH3 accuracy is defined as the change in RMSD of the CDRH3 region, when superposing the predicted antibody (in the antibody–antigen complex prediction) onto the experimentally resolved antibody (in the antibody–antigen complex) using the antibody framework region. Statistical significance values (Wilcoxon rank‐sum test) were calculated between RMSD values for sets of predictions at the outset of recycling iterations (recycle = 0) versus at recycle = 3, as noted at top (***p ≤ 0.001). (d) Example of a prediction across recycling iterations (PDB 7kd2; nanobody/Ricin complex). This prediction's CAPRI accuracy level across recycles was incorrect at recycle = 0 (I‐RMSD = 17.98 Å), incorrect at recycle = 1 (I‐RMSD = 10.90 Å), acceptable at recycle = 2 (I‐RMSD = 2.52 Å), and medium at recycle = 3 (I‐RMSD = 1.45 Å). The CDRH3 RMSDs of the predictions across recycling iterations 0, 1, 2, and 3 were 1.39 Å, 1.19 Å, 1.27 Å, and 1.17 Å, respectively. The L‐RMSDs of the predictions across recycling iterations 0, 1, 2, 3 were 49.95 Å, 24.68 Å, 5.42 Å, 4.25 Å, respectively. Antibody and antigen chains of the predictions and x‐ray structure are colored as indicated. Predictions were generated with ColabFold due to its faster model generation speed compared to AlphaFold.