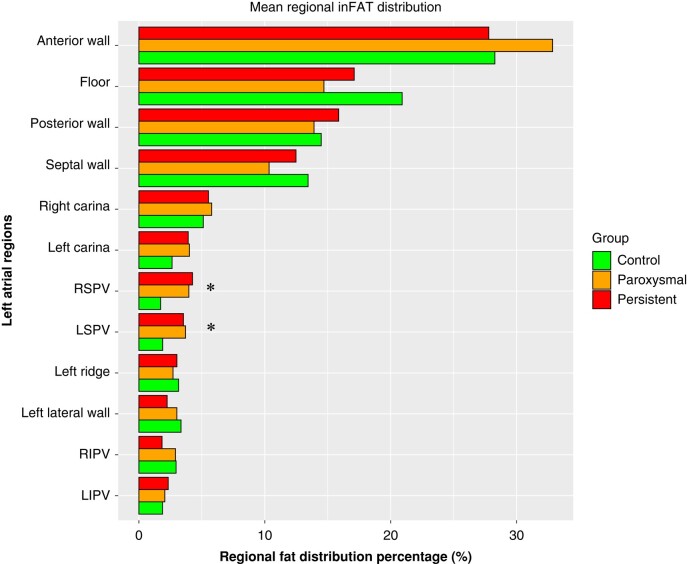
Figure 6.
Regional inFAT distribution analysis, stratified by the three study groups. Bar plot reports, for each of the evaluated segment, the mean regional inFAT distribution percentage. The asterisk denotes statistically significant differences across the three study group (one-way ANOVA test). inFAT, infiltrated adipose tissue.

