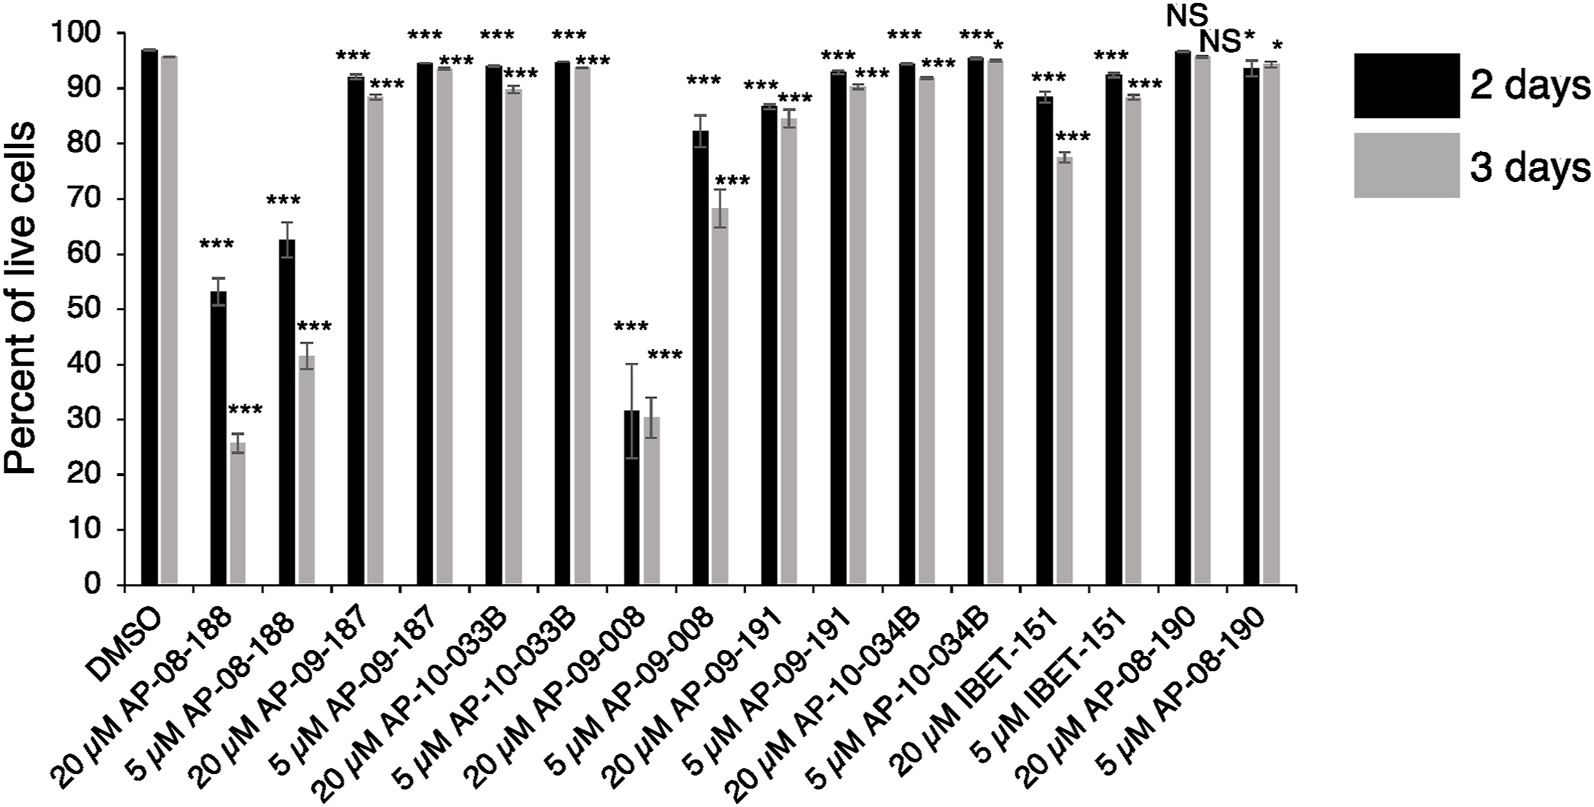
Fig. 4. AP-09-008 and AP-08-188 inhibit growth in T. brucei parasites.

Bar graph showing flow cytometry data for the percent of live cells based on gating for forward and side scatter following treatment for 48h or 72h with the indicated drugs and concentrations. Error bars show standard deviation of the mean from 3 biological replicates. *** indicates a p-value <0.001 derived from a 2 tailed unpaired t-test of values for drug treatment compared to treatment with DMSO. ** indicates a p-value <0.01 and * indicates a p-value <0.05. NS, not significant.
