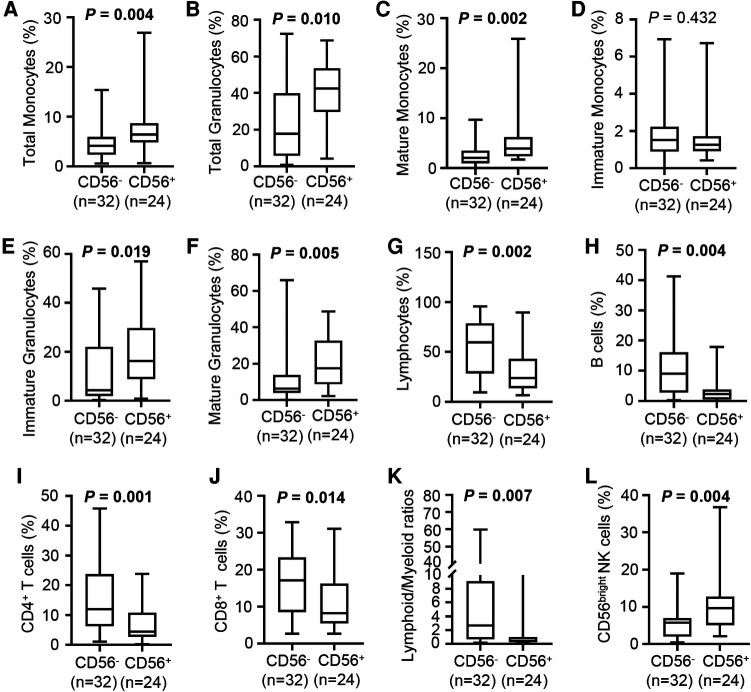
Figure 3.
Cellular composition of bone marrow in CD56− and CD56+ patients. (A–F) Box plots depict the percentage of total monocytes (A), total granulocytes (B), mature monocytes (C), immature monocytes (D), immature granulocytes (E), and mature granulocytes (F) in CD56− and CD56+ patients. (G–J) Box plots depict the percentage of lymphocytes (G), B cells (H), CD4+ T cells (I), and CD8+ T cells (J) in CD56− and CD56+ patients. (K) Box plot depicts the lymphoid/myeloid ratios in CD56− and CD56+ patients. (L) Box plot depicts the percentage of CD56bright NK cells in CD56− and CD56+ patients. Lines in the boxes indicate medians; bottom and top whiskers indicate minimum and maximum values, respectively. The cell population percentage represented the proportion within all nucleated cells. Values in bold denote statistical significance at the level P < 0.05.

