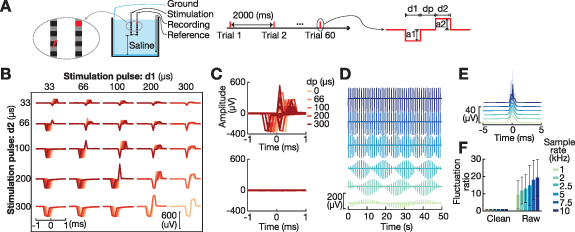
Figure 2.

Single-pulse electrical stimulation (SPES) artifacts generated in saline solution. (A) Bench-top recording settings. SPES was delivered every 2000 ms, with 60 trials recorded for each pulse shape. Each stimulation pulse shape was defined by five parameters. d1, dp, and d2 define the length of each pulse phase. a1/a2 define the amplitude of the negative/positive pulse phase, respectively. (B) We generated 110 different stimulation pulse shapes from combinations of d1 (33, 66, 100, 200, 300 µs), d2 (33, 66, 100, 200, 300 µs), dp (0, 66, 100, 200, 300 µs), a1 (100 µA) based on the commonly used configuration settings (Albert et al 2009). The summation of d1, dp, and d2 was restricted to not exceed 600 µs, with a2 defined as . (C) Temporal dynamics of saline artifacts for all pulse shapes prior to (top) and after (bottom) applying MPARRM (averaged across trials, n = 60). (D)–(E) Effect of sampling rate (1–10 kHz) on the ability to accurately record the amplitude and shape of the SPES artifact. (F) Performance of MPARRM in removing SPES artifacts. For each pulse shape, we calculated the signal fluctuation (standard deviation) during baseline period (1000 ms to 200 ms preceding the stimulation onset) and artifact period (1 ms preceding and 1 ms following stimulation onset). We then calculated the signal fluctuation ratio between the artifact and baseline periods. A ratio equal to ∼1 means that the stimulation artifact has been completely removed. MPARRM effectively removed the artifact from the signal, irrespective of the sampling rate and pulse shape. Specifically, 1 kHz: 9.4 ± 8.2 to 0.91 ± 0.09; 2 kHz: 11.9 ± 7.9 to 0.92 ± 0.09; 2.5 kHz: 13.0 ± 8.0 to 0.93 ± 0.08; 5 kHz: 14.8 ± 11.8 to 0.92 ± 0.08; 7.5 kHz: 18.0 ± 11.5 to 0.95 ± 0.08; and 10 kHz: 19.3 ± 10.6 to 0.92 ± 0.06 (before/after MPARRM, mean ± s.d., n = 110).
