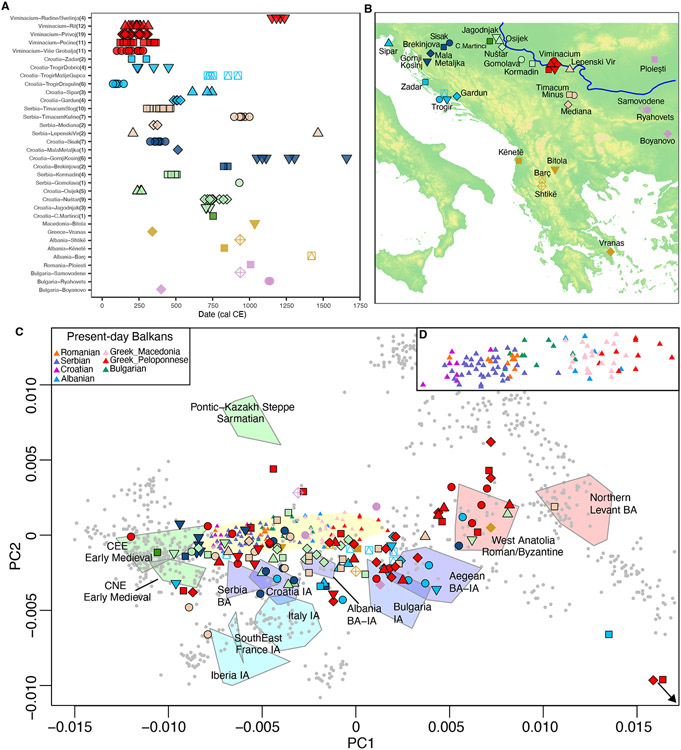
Figure 1. Overview of ancient Balkan individuals analyzed in this study.
(A) Chronological distribution. Individuals with newly reported data are represented by symbols with a black outline. (B) Geographical location of archaeological sites. (C) PCA of the West-Eurasian genetic variability showing present-day individuals as grey circles (except present-day Balkan populations that are displayed with open colored triangles), and relevant ancient populations as colored polygons (Balkan Iron Age groups in blue, Southern European Iron Age groups in light blue, ancient Near Easter groups in red and ancient Steppe, Central, Northern and Eastern European groups in green) including all individuals in each population (Data S2, Table 3). Ancient individuals were projected onto the PCs computed on present-day West Eurasians; their shape and color are the same as in panels (A) and (B). This PCA is a zoom-in version of Figure S1. (D) Closer view of the present-day Balkans genetic cline from panel (C). CNE: Central/Northern European; CEE: Central/Eastern European; BA: Bronze Age; IA: Iron Age.

