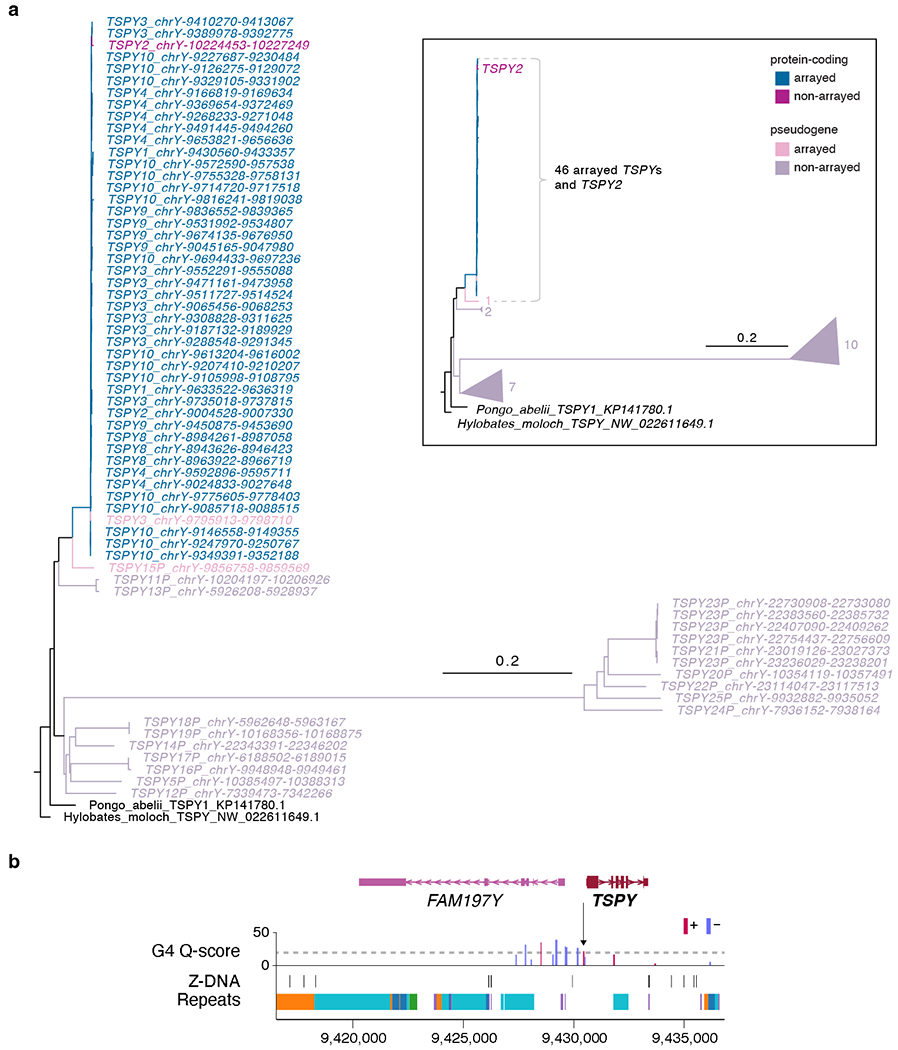
Extended Data Fig. 6 |. Phylogenetic tree analysis of the ampliconic TSPY gene family and pattern of non-B DNA structure.

a. Phylogenetic tree analysis using protein-coding TSPYs from a Sumatran Orangutan (Pongo abelii) and a Silvery gibbon (Hylobates moloch) as outgroups confirmed TSPY2 (distal to the array) and TSPY copies within the array originated from the same branch, distinguished from the rest of the TSPY pseudogenes. Rectangular inset shows a cartoon representation of the simplified tree. Numbers next to the triangles indicate the number of TSPY genes in the same branch. b. G4 and Z-DNA structures predicted for a typical TSPY copy inside the TSPY array. All TSPY copies in the array have the same signature, with one G4 peak present ~500 bases upstream of the TSPY (arrow). Higher Quadron score122 (Q-score) indicates a more stable G4 structure, with scores over 19 considered stable (dotted line).
