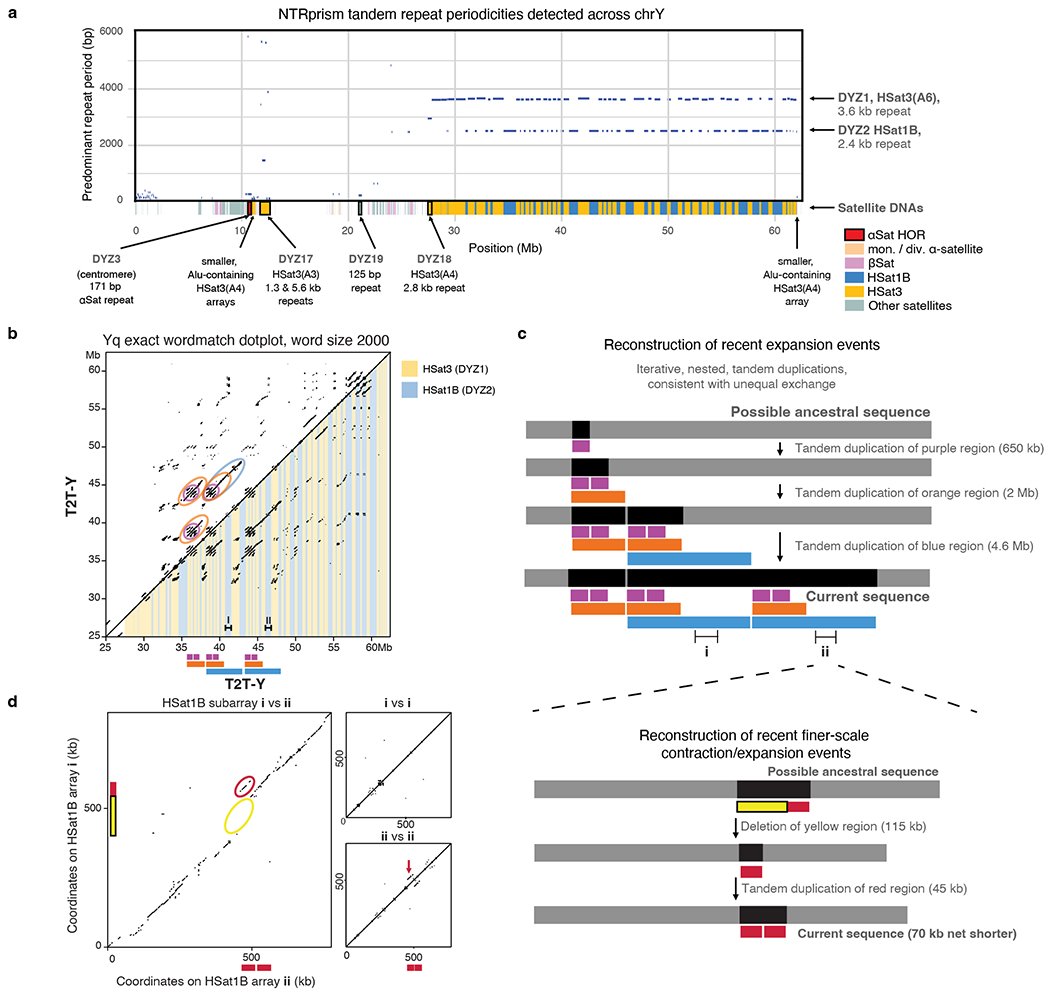
Extended Data Fig. 8 |. Satellite annotation and recent expansion events in the Yq heterochromatin.

a. A plot showing the top repeat periodicities detected by NTRprism46 in 50 kb blocks tiled across T2T-Y, with centromeric satellite annotations overlaid on the X axis. Large arrays are labeled with their historic nomenclature1, HSat subfamilies64, and predominant repeat periodicities. b. An exact 2000-mer match dotplot of the Yq region (a dot is plotted when an identical 2000 base sequence is found at positions X and Y). The lower triangle has DYZ1/DYZ2 annotations overlaid as yellow and blue bars, respectively. Circled patterns in the upper triangle correspond to recent iterative duplication events, which are illustrated below the X axis. c. A reconstruction of a possible sequence of recent iterative duplications that could explain the observed dotplot patterns. d. A 2000-mer dotplot comparison of two ~800 kb HSat1B sub-arrays that were part of a recent large duplication event, along with self-self comparisons of the same arrays, revealing sites of more recent and smaller-scale deletions and expansions (annotated in yellow and red, with a possible sequence of events illustrated by the schematic on the right).
