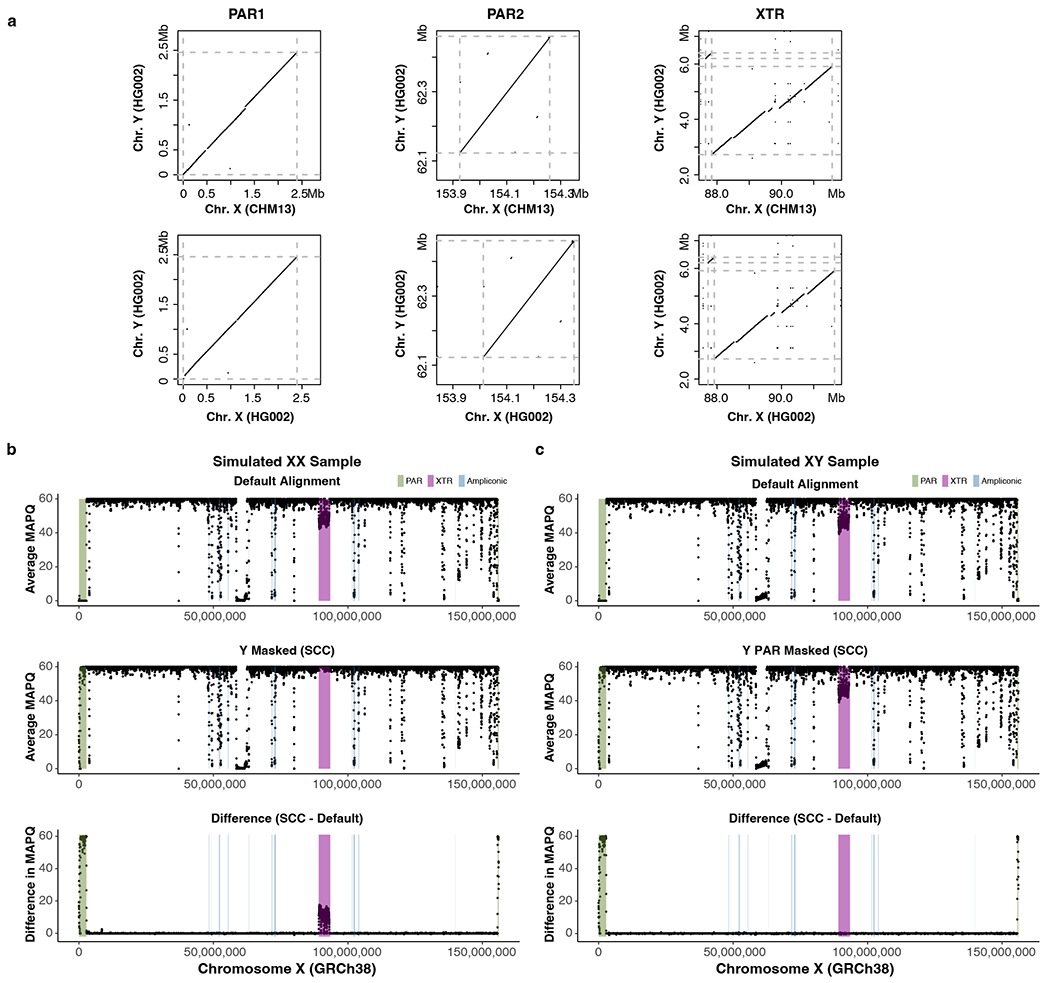
Extended Data Fig. 9 |. Genomic similarity in PARs and XTR and improved MAPQ of the PARs through informed sex chromosome complement reference.

a. Dotplots from LASTZ alignments of the CHM13-X, HG002-X, and HG002-Y (T2T-Y) over 96% sequence identity. Dashed gray lines represent the start and end of the approximate PARs or XTR boundaries. Disconnected diagonal lines indicate the presence of genomic diversity between each paired region. More genomic differences are observed in the PAR1 between the HG002-Y and CHM13-X. b-c. Average mapping quality (MAPQ) across GRCh38-X from simulated reads of an XX (b) and XY (c) sample. Top, a default version of GRCh38 (with two copies of identical PARs on XY). Middle, a version of GRCh38 informed on the sex chromosome complement (SCC) of the sample (entire Y hard-masked for the XX sample vs. only PARs on the Y hard-masked for the XY sample). Bottom, the difference in average MAPQ between the SCC and default approaches. MAPQ was averaged in 50 kb windows, sliding 10 kb across the chromosome. A positive value means MAPQ score is higher with SCC reference alignment compared to default alignment.
