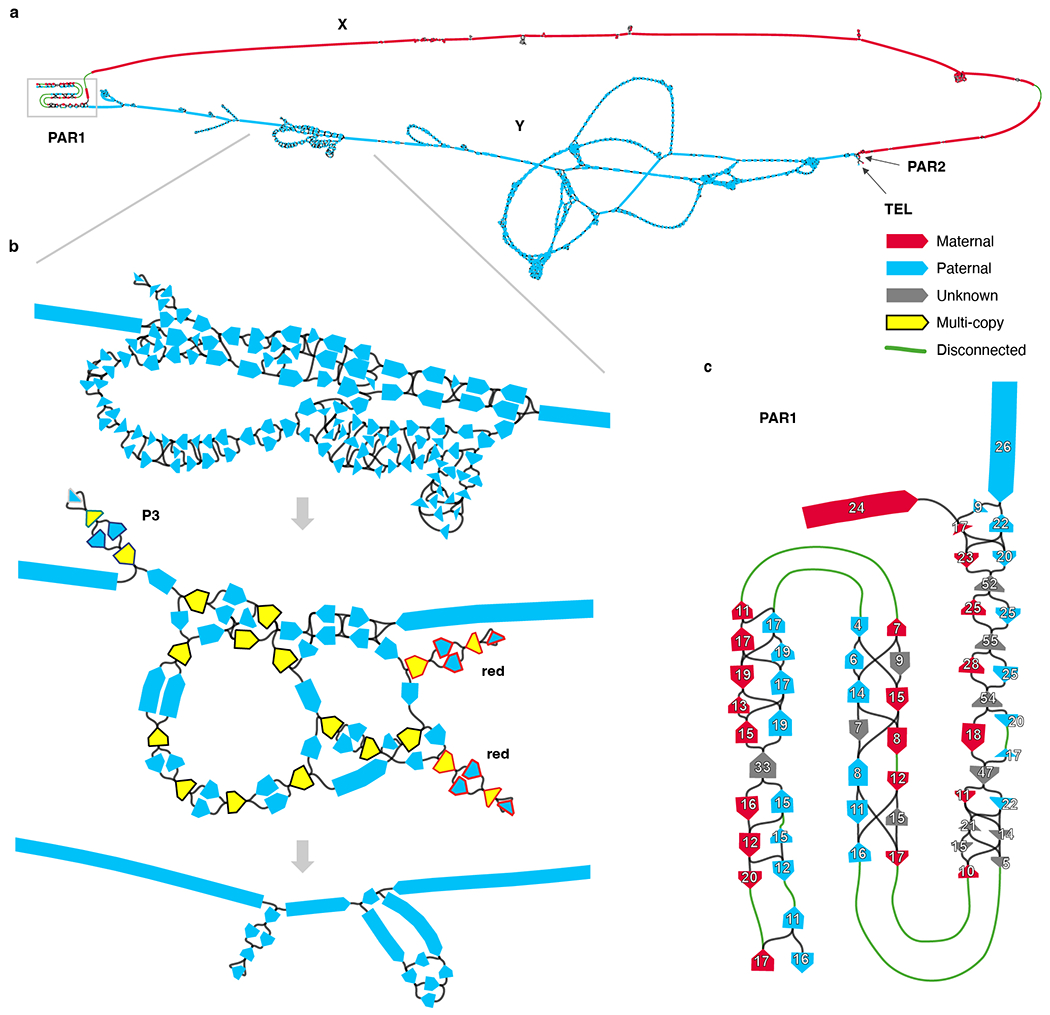
Extended Data Fig. 1 |. Assembling the X and Y chromosomes of HG002.

a. Chromosome X and Y components of the assembly string graph built from HiFi reads, detected based on node sequence alignments to T2T-CHM13 and GRCh38 references. Each node is colored according to the excess of paternal-specific (blue) and maternal-specific (red) k-mers, obtained from parental Illumina reads, indicating if they exclusively belong to chromosome Y or X, respectively. Most complicated tangles are localized within the heterochromatic satellite region on the Y q-arm. The X and Y subgraphs are connected in PAR1 and PAR2. Graph discontinuities are due to a lack of HiFi sequence coverage in these regions caused by contextual sequencing bias, with 9 out of 11 observed breaks falling within PAR1 on either chromosome (5 out of 5 for chromosome Y). Note that for visualization purposes the length of shorter nodes is artificially increased making the extent of the tangles appear larger than reality. b. The effects of manual pruning and semi-automated ONT read integration is illustrated from top to bottom. Top, zoomed in view of a tangle encoding the P1–P3 palindromic region in Y (approx. 22.86–27.08 Mb, see Fig. 4). Middle, corresponding subgraph following the manual pruning and recompaction. Nodes excluded from the curated “single-copy” list for automated ONT-based repeat resolution are shown in yellow. Three hairpin structures are highlighted, which form almost-perfect inverted tandem repeats encompassing the entire P3 and two P2 (red) palindromes. Node outlines in the palindromes are colored according to the palindromic arms as in Fig. 4. Bottom, corresponding subgraph following the repeat resolution using ONT read-to-graph alignments. Remaining ambiguities were resolved by evaluating ONT read alignments to all candidate reconstructions of the corresponding sub-regions. c. PAR1 subgraph labeled with HiFi read coverage on each node. Gaps (green edges) and uneven node coverage estimates indicate biases in HiFi sequencing across the region. Fig. 1 shows an enrichment of SINE repeats and non-B DNA motifs in PAR1 that may underlie the sequencing gaps in this region.
