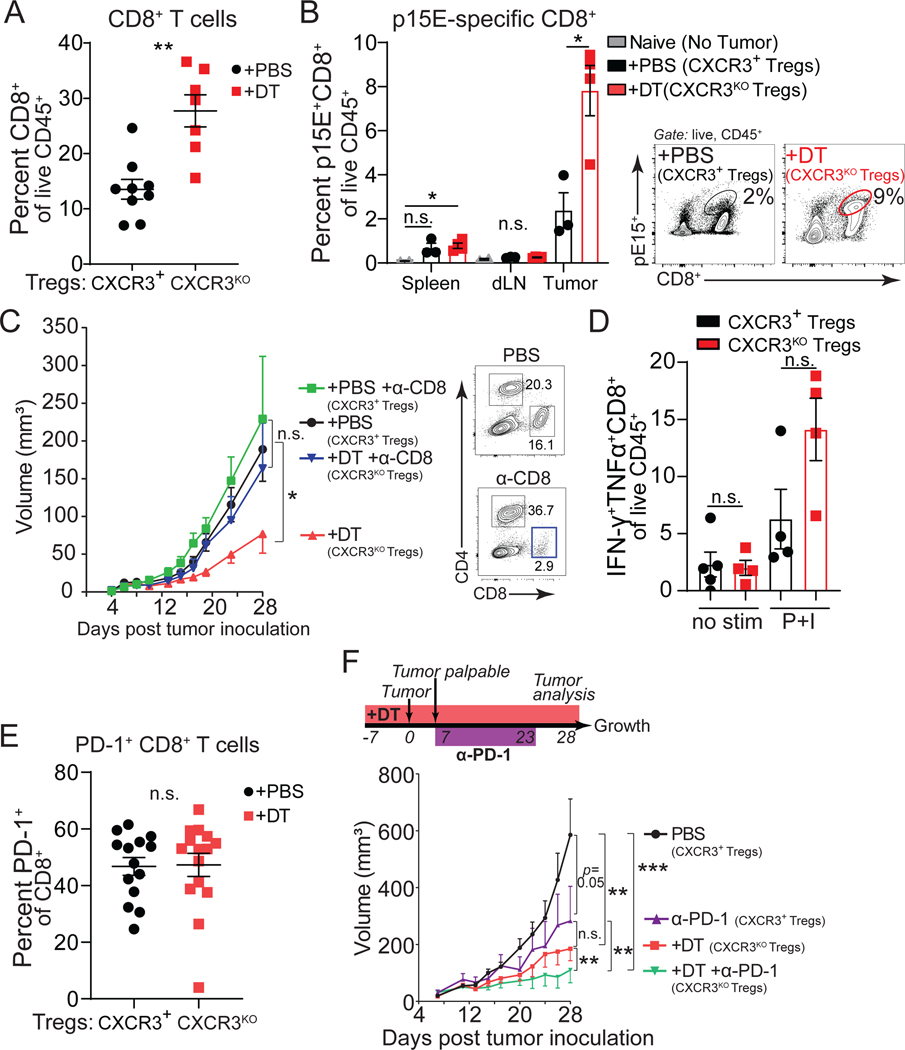
Figure 3. Enhanced CD8 tumor immunity with Cxcr3KO Treg cells.
(A-B) Quantification of total intratumoral CD8+ T cells from Foxp3DTR-GFP;Cxcr3+/Foxp3TM2-GFP; Cxcr3KO female mice harboring Cxcr3+ (+PBS, black) or Cxcr3KO (+DT, red) Treg cells in MC38 tumors (day 28) (n=6–8 per group, data pooled from two independent experiments).
(B) Tumor-specific p15E-reactive CD8+ T cells were measured from indicated organs (day 15, MC38) (n=4–5 mice per group, data representative of two independent experiments). Mice without tumors (naïve) served as a negative control for p15E/Kb tetramer stain (grey). Representative flow cytometric analysis of intratumoral pE15 tetramer stain in PBS and DT treated mice (right panel).
(C) Growth of MC38 tumors in control females (+PBS, black), control females treated with anti-CD8 depleting antibody (+PBS +α-CD8, green), Cxcr3KO Treg cell females (+DT, red), or Cxcr3KO Treg cell females treated with an anti-CD8 depleting antibody (+DT +α-CD8, blue) (n=8 mice per group, representative of two independent experiments). Representative flow cytometric analysis of CD4+ and CD8+ cells in spleens of control or anti-CD8 treated groups (right panel).
(D) IFN-γ+TNFa+CD8+ of Live CD45+ in tumors (day 15, MC38) from indicated mice after no stimulation (no stim) or stimulation with PMA and Ionomycin (P+I) ex vivo (n=4–5 per group).
(E) PD-1 expression on intratumoral CD8+ T cells (day 28, MC38) (data pooled from three independent experiments).
(F) Growth of MC38 tumors in mice with Cxcr3+ (+PBS, black) or Cxcr3KO Treg cells (+DT, red), or treated with anti-PD-1 in mice with Cxcr3+ (+α-PD-1, purple) or Cxcr3KO Treg cells (+DT+α-PD-1, green) (n=6–7 mice per group).
Data represent mean ± SEM; *p < 0.05, **p < 0.01, ***p < 0.001 from two-way ANOVA followed by Dunnet’s multiple comparisons test, two-way ANOVA with Sidak’s multiple comparisons, or student’s t tests. Tumor growth assessed using multiple regression analyses. Also see Figure S3.

