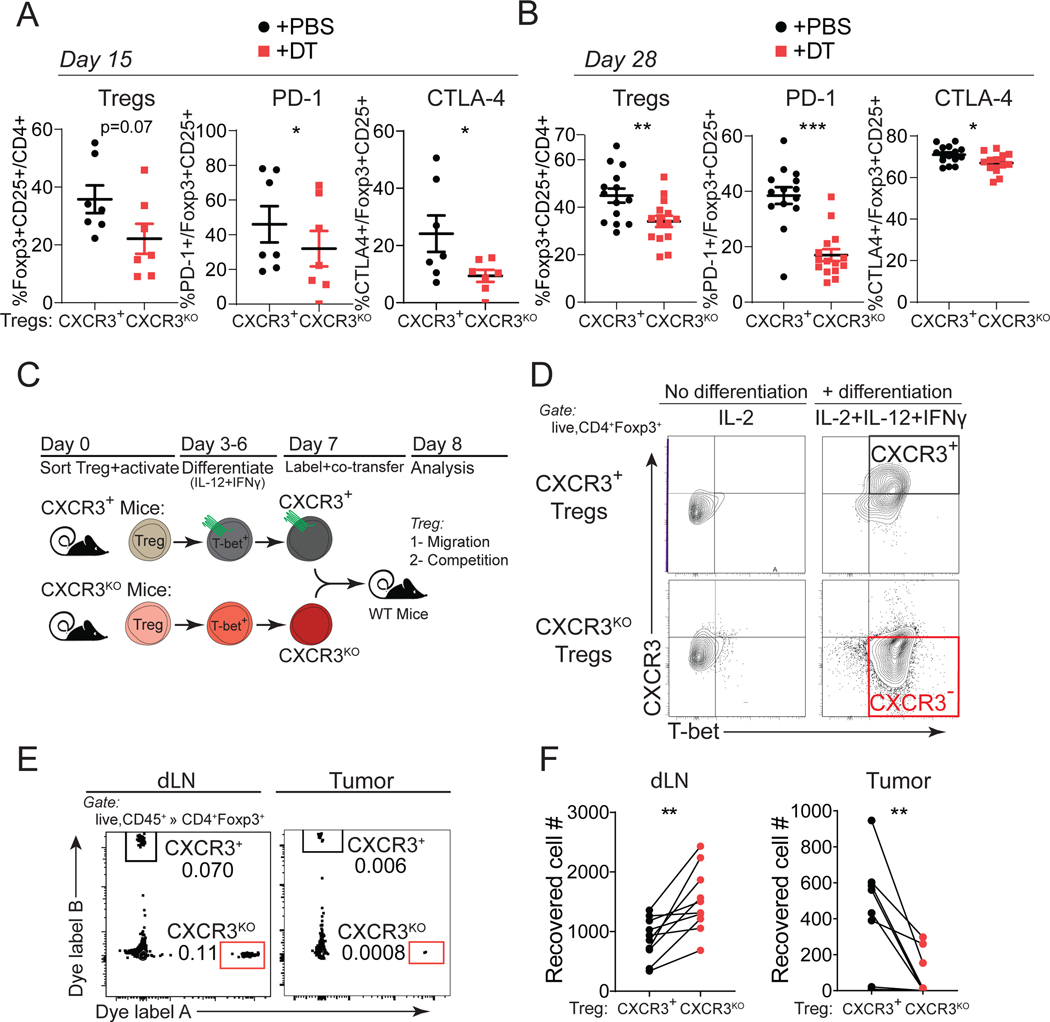
Figure 4. CXCR3 is required for Treg accumulation and activation in tumors.
(A-B) Quantification of intratumoral Treg cell frequency or their PD-1 and CTLA-4 expression from Foxp3DTR-GFP;Cxcr3+/Foxp3TM2-GFP;Cxcr3KO female mice harboring Cxcr3+ (+PBS, black) or Cxcr3KO (+DT, red) Treg cells at day 15 (A) or day 28 (B) of MC38 tumor progression (n=7 mice per group, pooled from two independent experiments).
(C) Schematic describing the generation of CXCR3+ and Cxcr3ΔTregcells by in vitro differentiation, fluorescent dye-labeling, and co-transfer into MC38 tumor-bearing mice for localization analysis.
(D) Analysis of Treg cells for CXCR3 and T-BET expression prior to adoptive transfer.
(E) Representative flow cytometry plots from dLN and MC38 tumors for transferred Cxcr3+ and Cxcr3KO Treg cells.
(F) Absolute number of Cxcr3+ (black) or Cxcr3KO Treg cells (red) cells recovered. Lines connect Treg cells collected from the same mouse (data pooled from three independent experiments).
Data represents mean ± SEM; *p < 0.05, **p < 0.01 by unpaired (or paired analysis in F) Student’s t tests. Also see Figure S4.

