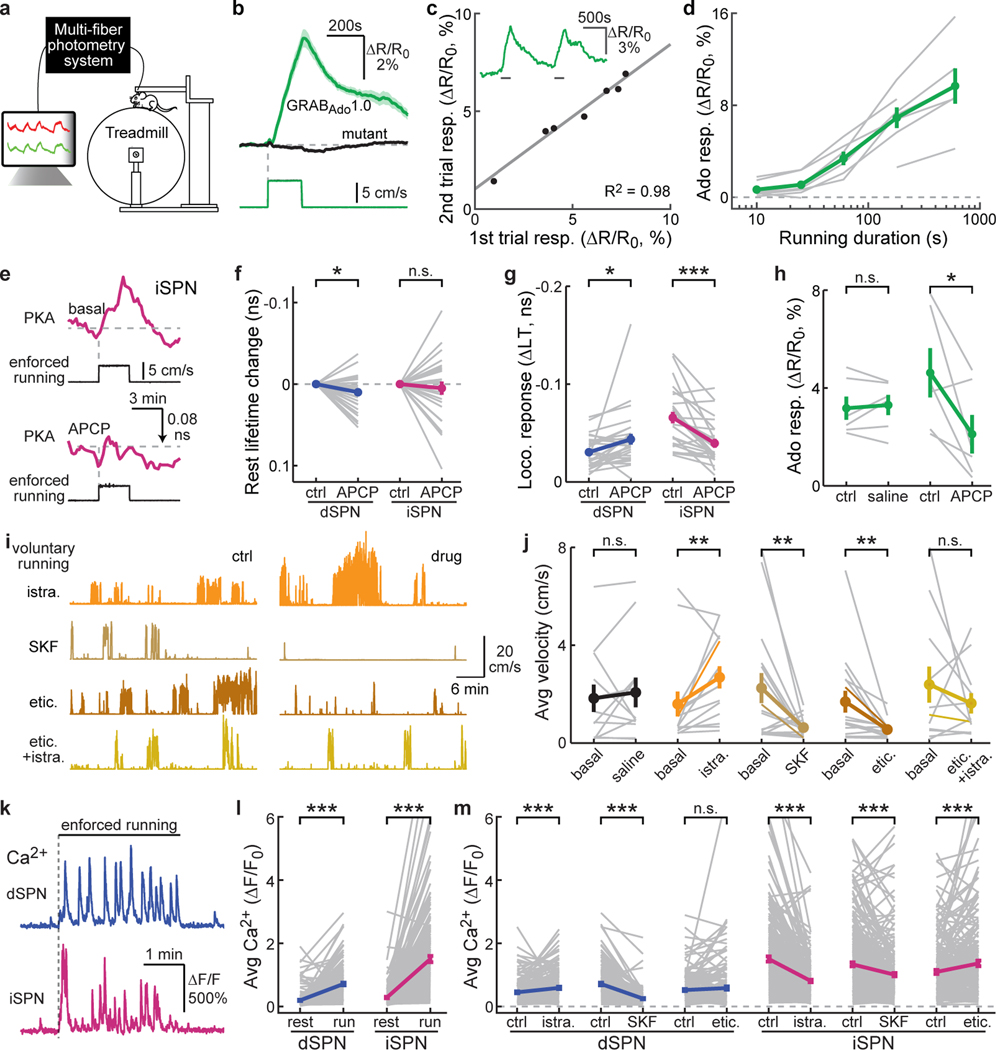
Fig. 4. Locomotion results in acute adenosine accumulation.
a, Schematic of fiber photometric recording while mice run on a treadmill. b, Averaged response of GRABAdo1.0 (green) and its mutant (black) elicited by enforced running. n (bouts/mice) = 33/6 for GRABAdo1.0 and 20/5 for mutant. c, Example trace (inset) and correlation of adenosine responses to two consecutive enforced running trials. n = 7 mice. d, Running duration-adenosine response relationship. From left to right time points, n = 7, 7, 6, 7, and 6. e, Representative traces of enforced running-induced PKA responses in iSPNs before and after local infusion of APCP. f & g, Collective changes of basal (f) and enforced running-induced PKA activity (g) in iSPNs and dSPNs after local infusion of APCP. From left to right, n (neurons/mice) = 28/4 and 26/6 for both panels. Two-tailed paired Student’s t-test, from left to right, p = 0.025, 0.54, 0.021, 4.9×10⁻⁵; dF = 27, 25, 27, 25; t = −2.4, −0.6, 2.5, −4.9. h, Collective changes of the GRABAdo1.0 response to 5 min enforced running before and after local infusion of saline or APCP. n (mice) = 6 for both. Two-tailed paired Student’s t-test, from left to right, p = 0.65 and 0.041; dF = 5 and 5; t = −0.48 and 2.73. i & j, Example traces (i) and collective running velocity (j) before and after intraperitoneal injection of the indicated drugs. From left to right, n (mice) = 12, 14, 16, 16, and 12. Two-tailed paired Student’s t-test on data normalized to the respective basal values on the log scale, from left to right, p = 0.42, 0.0024, 0.0086, 0.0017, 0.74; dF = 11, 13, 15, 15, 11; t = −0.8, −3.8, 3.0, 3.8, 0.3. k & l, Representative traces (k) and collective calcium responses (l) elicited by 3-min enforced running in dSPNs and iSPNs. n (neurons/mice) = 179/7 for dSPNs and 258/6 for iSPNs. Two-tailed paired Student’s t-test, from left to right, p = 2.9×10⁻²⁴ and 7.8×10−39; dF = 178 and 257; t = −11.9 and −15.5. m, Collective enforced running-elicited calcium responses before and after intraperitoneal injection of indicated drugs in dSPNs and iSPNs. From left to right, n (mice/neurons) = 171/6, 179/7, 188/6, 258/6, 290/7, and 214/6. Two-tailed paired Student’s t-test, from left to right, p = 2.9×10⁻⁵, 1.5×10⁻²⁷, 0.16, 6.2×10⁻²², 3.2×10⁻⁹, 7.1×10⁻⁴; dF = 170, 178, 187, 257, 289, 213; t = −4.3, 13.0, −1.4, 10.6, 6.1, −3.4. All error bars and error bands represent SEM and their centers represent the mean. n.s.: p > 0.05; *: p ≤ 0.05; **: p ≤ 0.01; ***: p ≤ 0.001.

