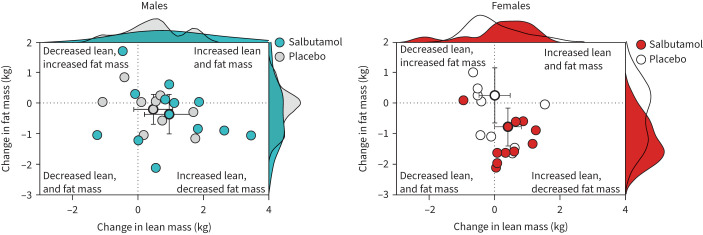
FIGURE 3.
Relationship between change in fat mass and lean mass after 6 weeks of exercise training with concurrent salbutamol inhalation in moderately trained males (n=21; left panels) and females (n=19; right panels). Plots on outer edges of panels denote the distributions of data points on the respective axes and were created in R with base density function using Gaussian distribution. Symbols with bold border are means and error bars are 95% confidence intervals.

