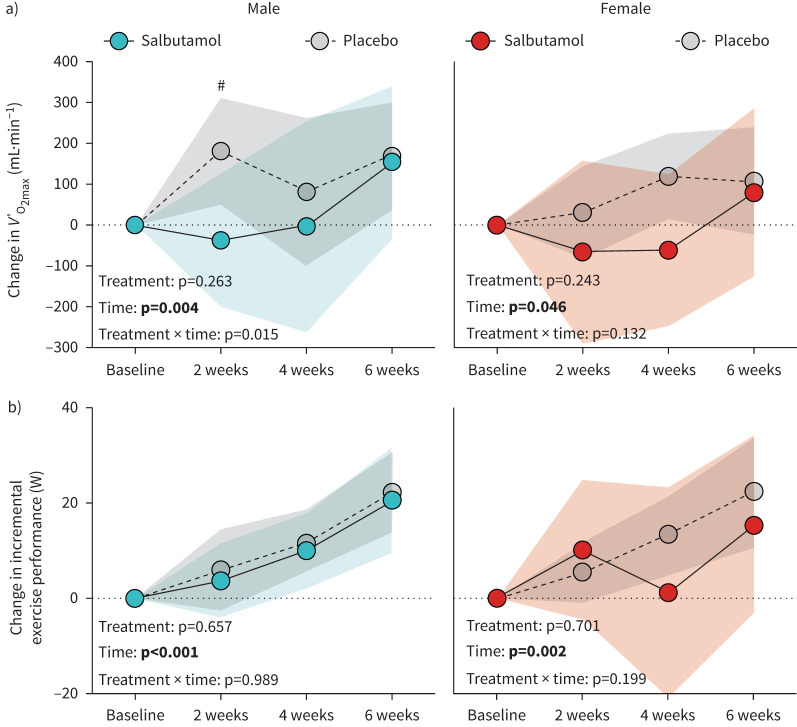
FIGURE 4.
Changes in a) maximum oxygen uptake (V′O2max) and b) incremental exercise performance during 6 weeks of exercise training with concurrent salbutamol inhalation in moderately trained males (n=21; left panels) and females (n=19; right panels). All values are changes relative to baseline. Symbols are means and shaded areas are 95% confidence intervals. p-values in bold denote statistical significance. #: between-group difference (p<0.05).

