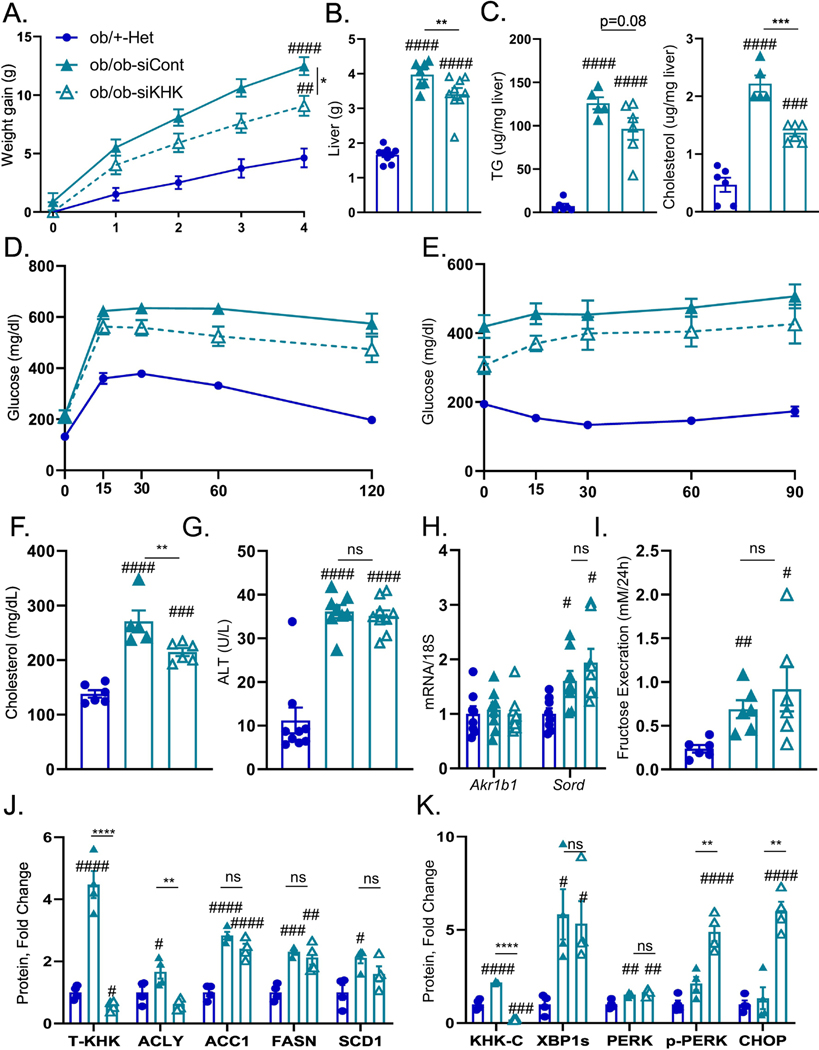
Figure 5. ER stress, but not lipogenesis, improves following T-KHK knockdown in Ob/Ob mice.
Weight gain A) in 2-month-old, male, heterezygote (Ob/+-Het), as well as in homozygous, leptin-deficient mice (Ob/Ob-siCont) treated with luciferase control, or KHK siRNA (Ob/Ob-siKHK) for four weeks, n=6–9 mice per group. B) Liver weight, C) hepatic triglycerides (TG) and cholesterol levels in these mice. D) Glucose tolerance test in these mice performed after 2 weeks following siRNA injection. E) Insulin tolerance test in these mice performed after 3 weeks following siRNA injection. Serum F) total cholesterol, as well as G) alanine aminotransferase (ALT) obtained at sacrifice, n=6–9 mice per group. Hepatic mRNA expression of H) genes regulating endogenous fructose production (Akr1b1, Sord). n=6 mice per group. I) Urinary fructose determined following 24h urine collection. Western blot quantification of KHK in the liver and proteins mediating J)de novo lipogenesis (ACLY, ACC1, FASN, SCD1) and K) ER stress (KHK-C, XBP1, PERK, CHOP) pathways. Sample number for WB is n=4. Statistically significant results are marked with # using one-way ANOVA analysis, with Dunnett’s multiple comparisons test to the Chow group, # p<0.05; ## p<0.01; ### p<0.001; #### p<0.0001, while * represents a post-hoc analysis between the groups under the line, *p <0.05; ** p<0.01, *** p<0.001, **** p<0.0001. All data are presented as mean ± S.E.M.

