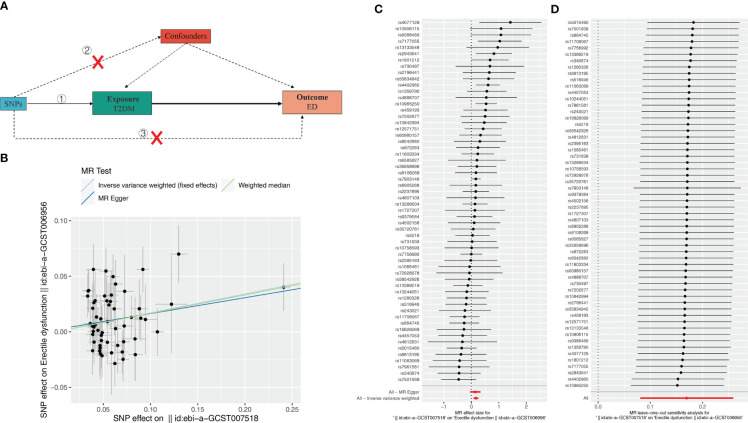
Figure 1.
Effect of T2DM on erectile dysfunction (ED). (A) Schematic diagram of the steps of the two-sample MR analysis. (B) Scatterplot showing the distribution of individual rate estimates for T2DM as a result of ED. Each scatterplot also contains trendlines derived from 3 different MR methods to indicate causality. (C) MR analysis forest plot of the association between T2DM and ED. The circles next to each SNP represent causal estimates for each IV, respectively, and the lowest two circles show multiple-instrument MR analysis using Egger regression and inverse-variance weighted methods. Horizontal lines denote 95% CIs. (D) MR leave-one-out sensitivity analysis, used to estimate the causal effect of T2DM on ED, each black point represents an IVW, the red point represents the estimated value using all IVs, and the horizontal line represents the 95% confidence interval.

