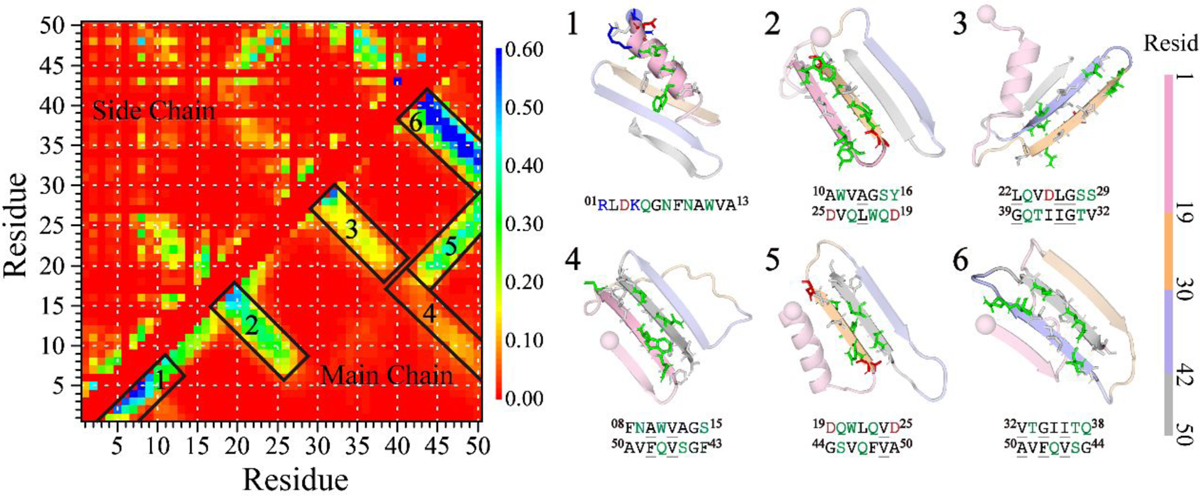
Figure 3. Residue-pairwise contact frequency analysis of the medin monomer.

The left panel shows the residue-pairwise contact frequency between main-chain heavy atoms (upper diagonal) and side-chain heavy atoms (lower diagonal) within the medin monomer. Representative structured motifs with high contact frequency patterns, mainly corresponding to helices or β-sheets, are labeled as 1–6 and displayed on the right. The contact frequency map is generated using the last 300 ns trajectories of 30 independent DMD simulations after reaching a steady state.
