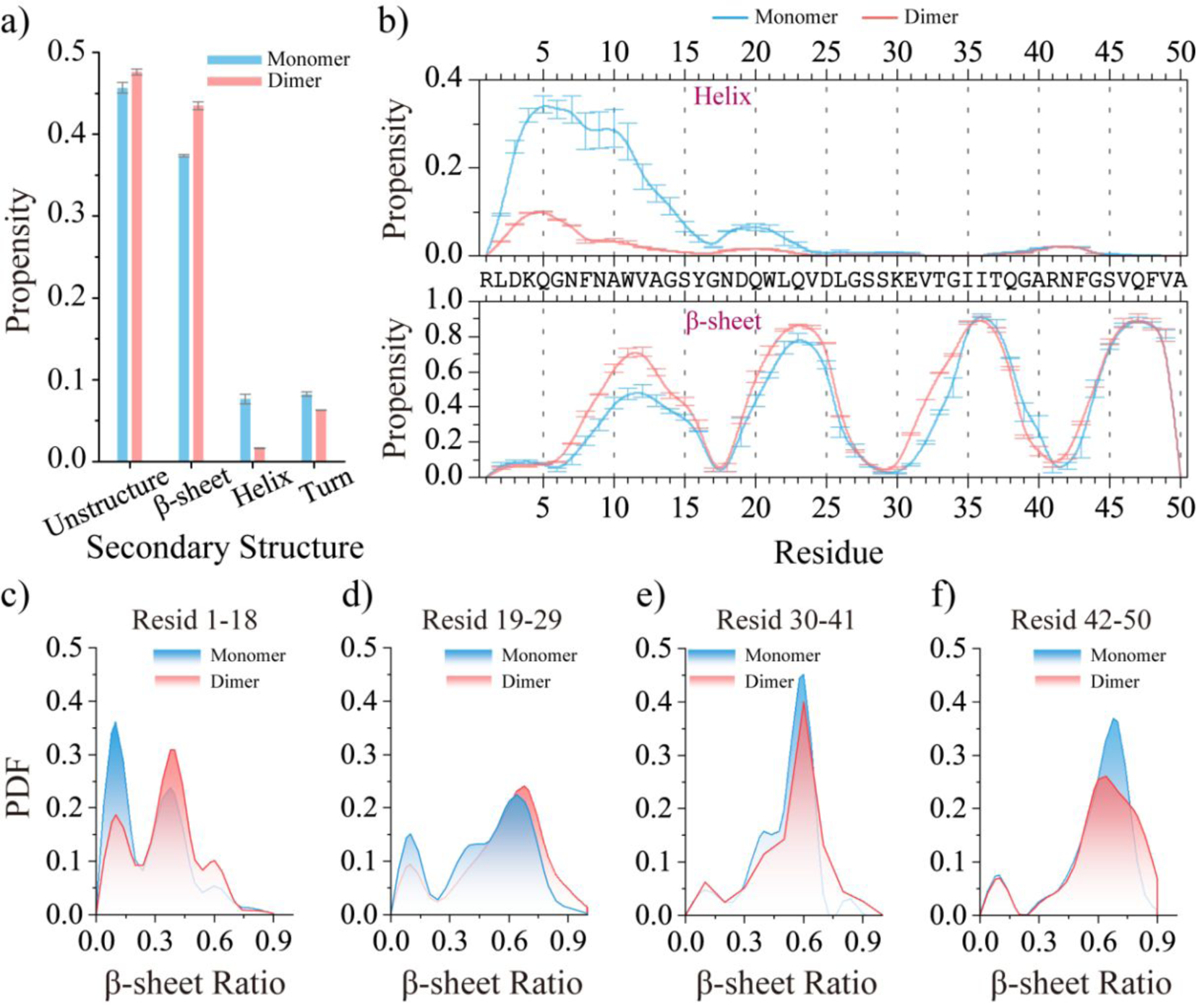
Figure 5. Comparing the secondary structure properties between medin monomer and dimer.

The average secondary structure propensity of monomeric and dimeric medin a). The average propensity of each residue to adopt helix (top) and β-sheet (bottom) conformations in the medin monomer and dimer b). The probability distribution of the β-sheet ratio for the segment of medin1–18 c), medin19–29 d), medin30–41e), and medin42–50 f) in medin monomer and dimer. To minimize potential bias from initial states, only the final 300 ns and 200 ns of the medin monomer and dimer simulations, respectively, were used for the ensemble average secondary structure analysis.
