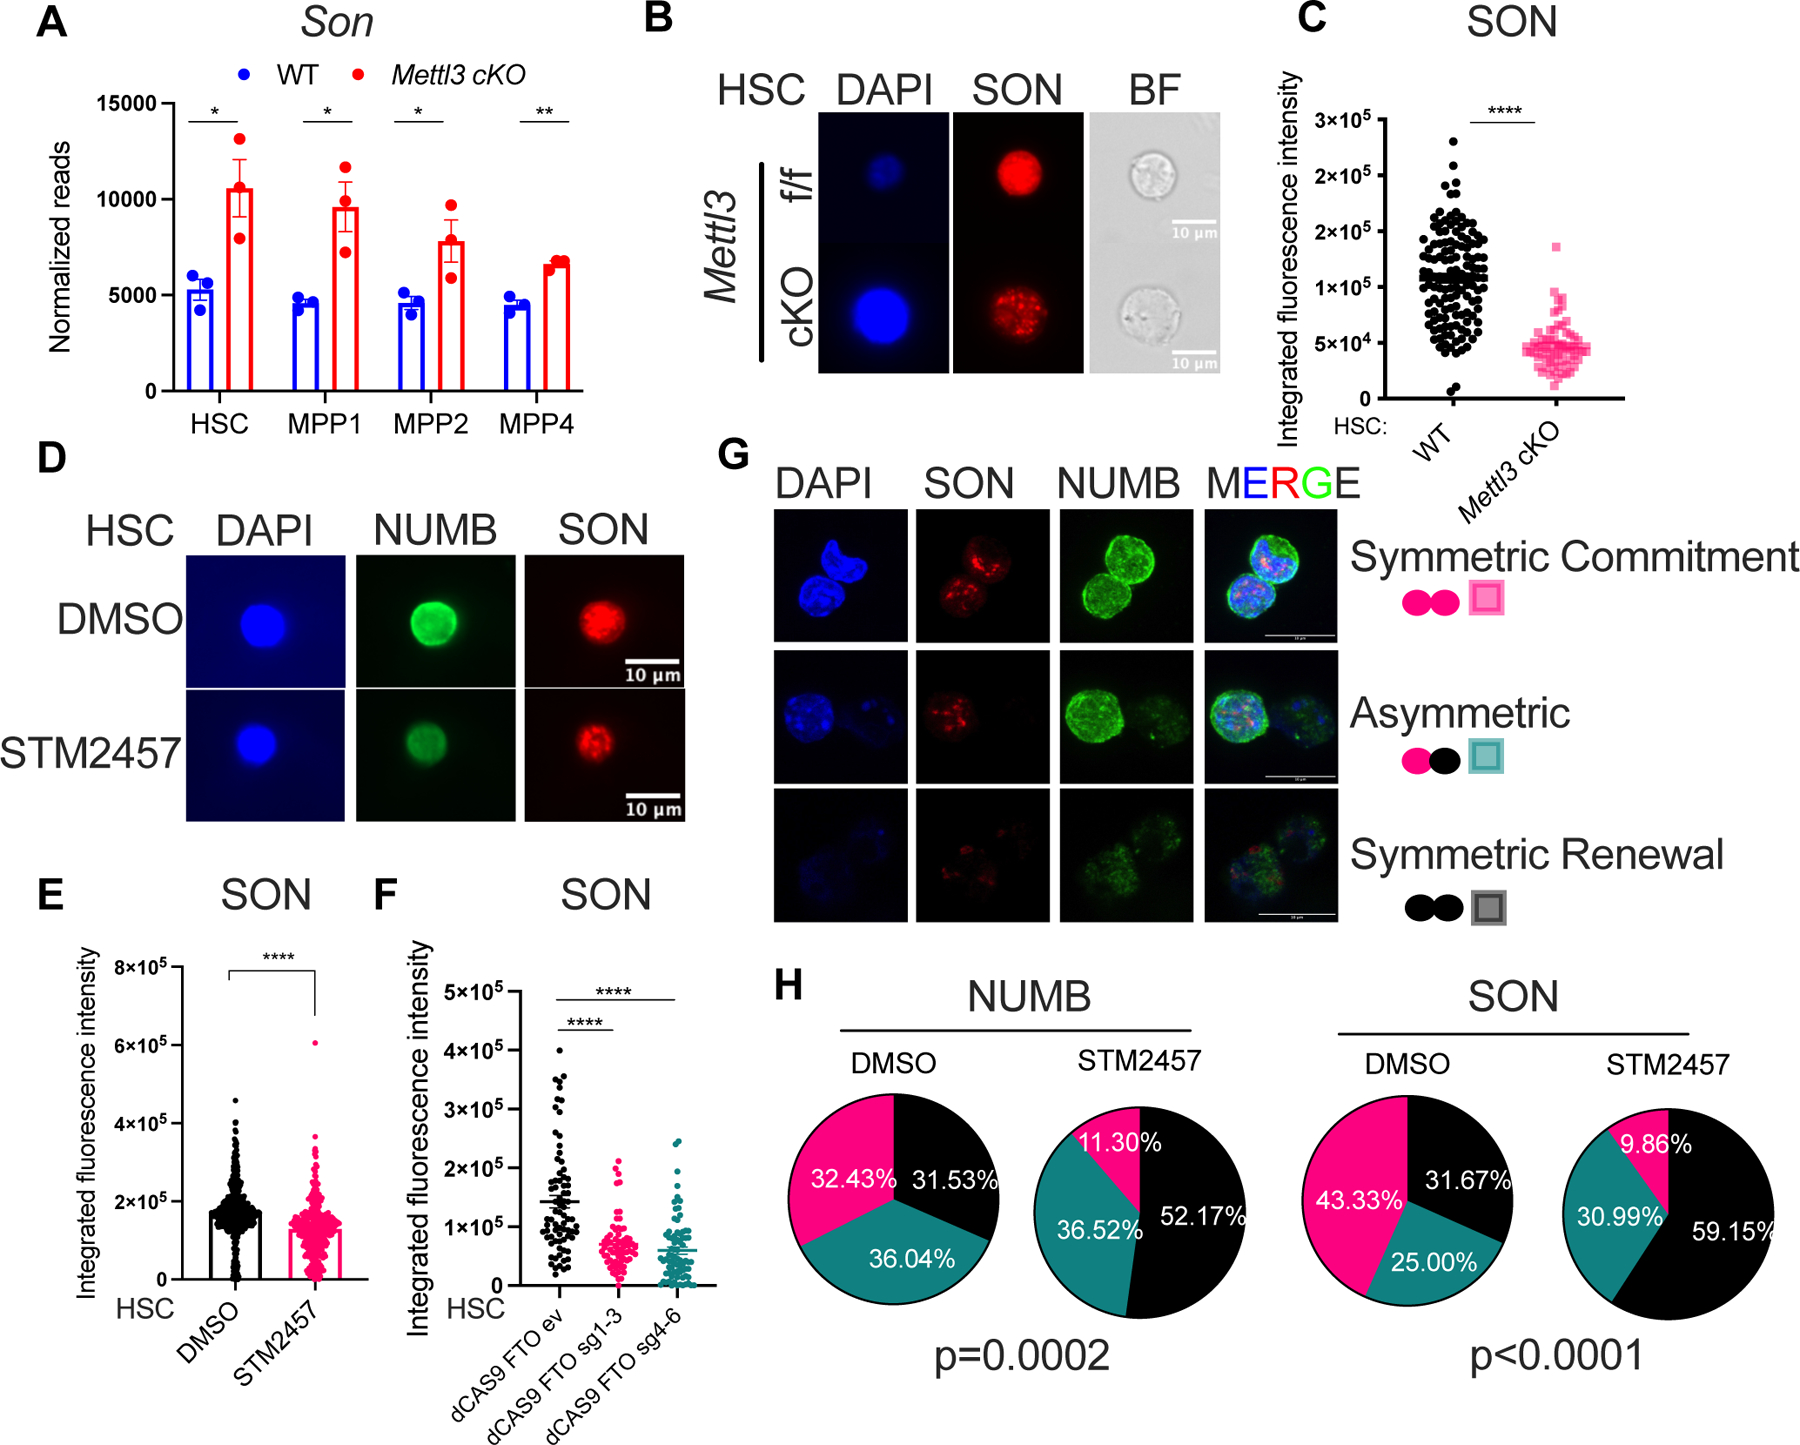
Figure 2: Depletion of m6A reduces SON protein abundance. See also Figure S2.

(A) Increased Son mRNA level in Mettl3 cKO HSC and MPPs. n=3, n represents number of mice.
(B) Representative immunofluorescence images of SON protein abundance in WT and Mettl3 cKO HSCs. Scale bar: 10μm.
(C) Reduced SON protein abundance by immunofluorescence in Mettl3 cKO HSCs. n=3 independent experiments.
(D) Representative immunofluorescence images of SON protein abundance in WT HSCs with DMSO or STM2457 treatment (20μM 40hr). Scale bar: 10μm.
(E) Reduced SON protein abundance in WT HSCs with STM2457 treatment (20μM 40hr) measured by immunofluorescence.
(F) Targeted demethylation of Son mRNA reduced SON protein abundance in WT HSCs.
(G) Representative confocal immunofluorescence images of HSC paired daughter cell assays. Paired daughter cells were stained with DAPI (blue), NUMB (green), SON (red). Scale bar: 10μm.
(H) Percentages of doublet cells in each type of cell division in WT HSCs with STM2457 treatment (20μM 40hr) measured by immunofluorescence. Number of daughter pairs assessed: n=111 (WT HSC quantified using NUMB IF); n=115 (WT HSC STM2457 quantified using NUMB IF); n=60 (WT HSC quantified using SON IF); n=71 (WT HSC STM2457 quantified using SON IF). P value was calculated using Chi-square test. n=2 independent experiments. Data in (A), (C), (E), (F) represent means ± s.e.m. , * represents p < 0.05. ** represents p < 0.01. *** represents p < 0.001. **** represents p<0.0001. ns represents p > 0.05.
