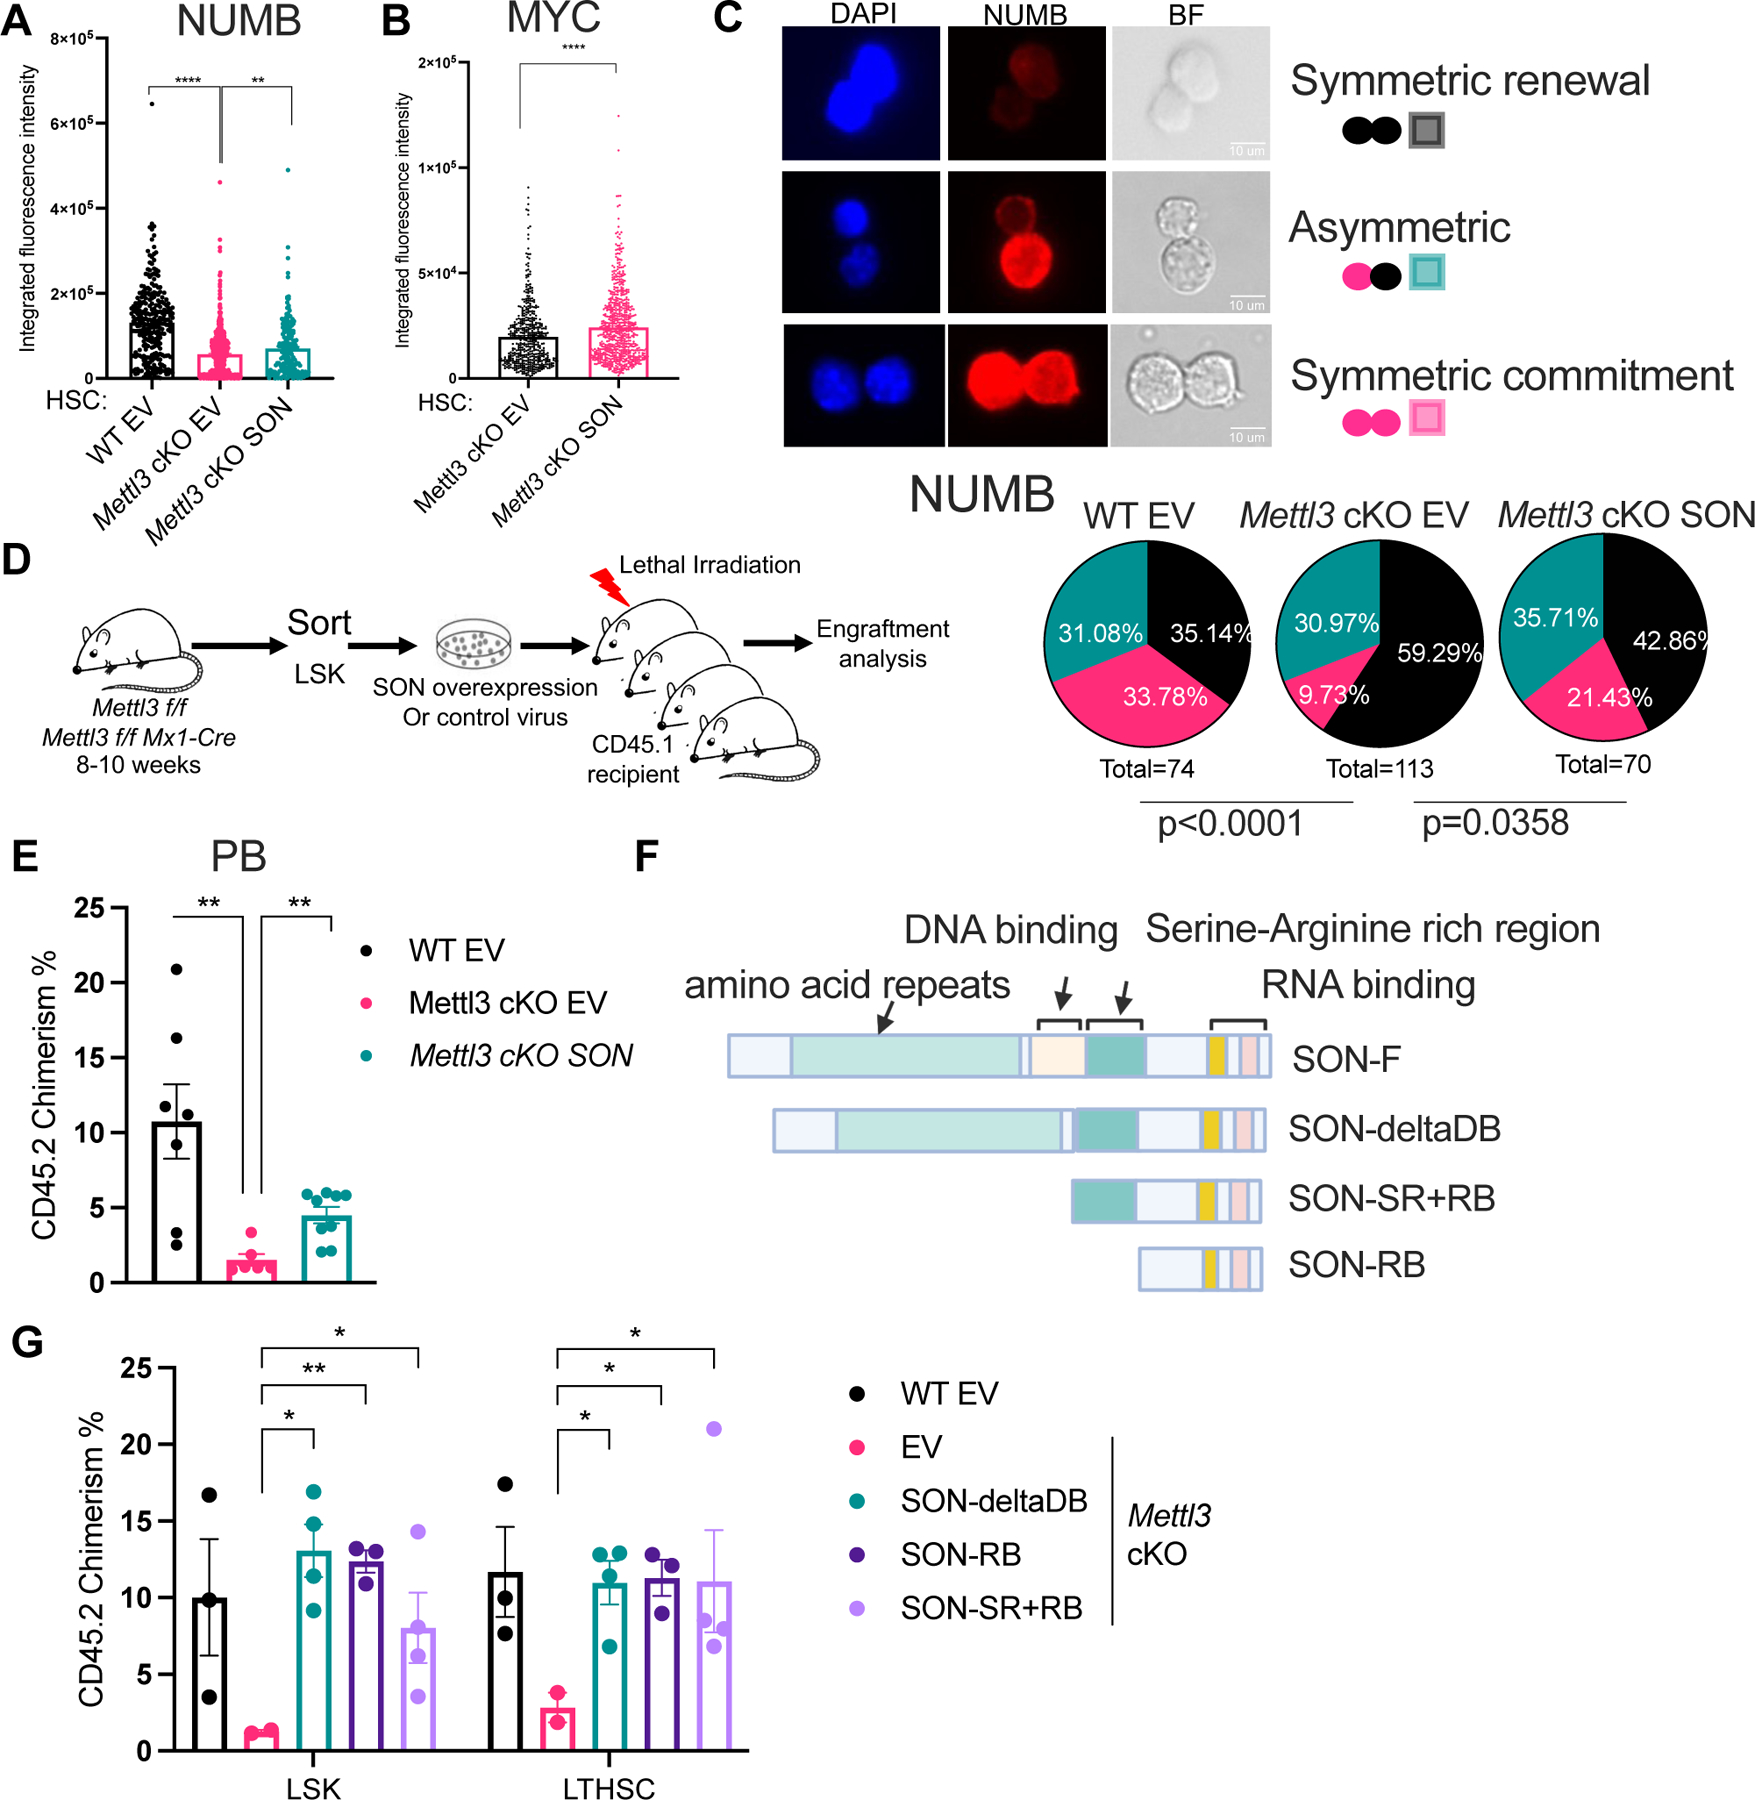
Figure 3: Forced SON expression rescues the function of m6A deficient HSCs. See also Figure S3.

(A) NUMB expression in Mettl3 cKO HSCs with SON overexpression compared to Mettl3 cKO HSCs and WT (Mettl3 f/f) HSCs as quantified by immunofluorescence. EV: empty vector controls; n=3 independent experiments.
(B) MYC expression in Mettl3 cKO HSCs with SON overexpression compared to Mettl3 cKO HSCs as quantified by immunofluorescence. n=2 independent experiments.
(C) SON overexpression in Mettl3 cKO HSC rescues its symmetric commitment defect measured by NUMB symmetric high divisions. Above: representative immunofluorescence images of paired daughter cells stained with DAPI (blue), NUMB (red), and brightfield. Scale bar: 10μm. Below: percentages of doublet cells in each type of cell division. n=74 (WT HSC EV); n=113 (Mettl3 cKO EV); n=70 (Mettl3 cKO SON); P value was calculated using Chi-square test.
(D) Scheme of transplant strategy in (E).
(E) Quantification of the frequency of donor-derived cells was shown in the peripheral blood at 4-week post transplantation, n = 6–9. n represents number of mice. Representative of three independent experiments.
(F) Scheme of SON truncation mutants.
(G) Quantification of the frequency of donor-derived cells was shown in the bone marrow LSK population 16 weeks post transplantation. n=2–4, n represents number of mice. Representative of three independent experiments. Data in (A), (B), (E), (G) represent means ± s.e.m. , * represents p < 0.05. ** represents p < 0.01. *** represents p < 0.001. **** represents p<0.0001. ns represents p > 0.05.
