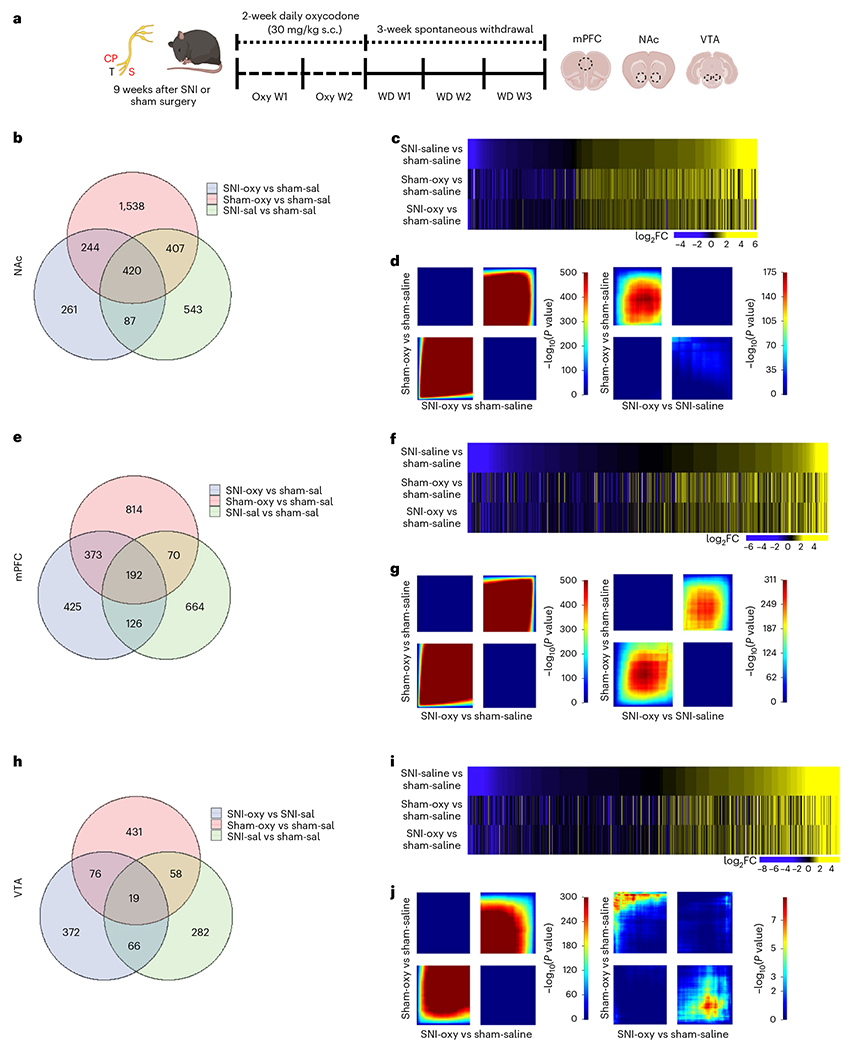
Fig. 3 |. Oxycodone withdrawal alters broad transcriptome patterns in brain reward regions of chronic neuropathic pain and pain-free mice.

a, Schematic paradigm for tissue collection of brain regions for bulk RNA-seq studies from adult male C57BL/6 mice. b,e,h. Venn diagrams representing the number of DEGs altered by chronic pain states (SNI-Sal versus Sham-Sal), oxycodone withdrawal in sham (Sham-Oxy versus SNI-Sal) and oxycodone withdrawal under chronic nerve injury states (SNI-Oxy versus Sham-Sal). c,f,i. Representative union heat maps of DEGs in matched comparisons across the NAc, mPFC and VTA respectively; yellow indicates increasing log2 fold change of gene expression, and blue represents decreasing expression. d,g,j. Threshold-free comparison of DEGs by RRHO for the NAc, mPFC and VTA. Each pixel represents the overlap between the transcriptome of each comparison as noted, with the significance of overlap (−log10(P value)) of a hypergeometric test color coded. The lower-left quadrant includes co-upregulated genes, the upper-right quadrant includes co-downregulated genes, and the upper-left and lower-right quadrants include contra-regulated genes. Genes along each axis are sorted from most to least significantly regulated from the middle to outer corners.
