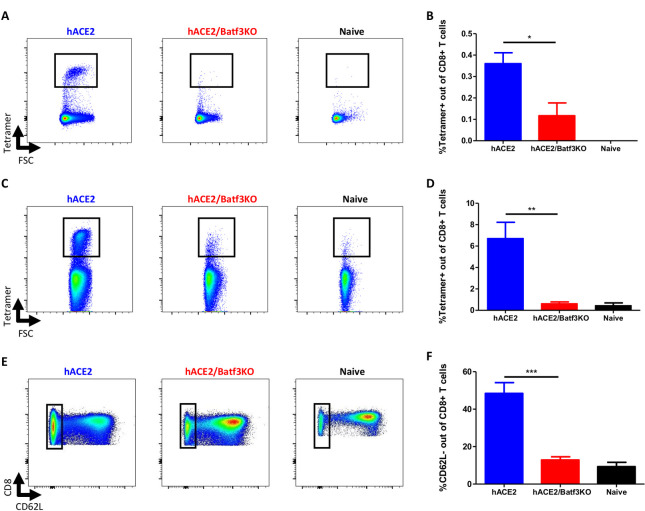
Fig 1. The cDC1 subset is required for priming of CD8 T-cells in the MLN and lungs following SARS-CoV-2 infection.
hACE2/Batf3KO (red) and hACE2 (blue) mice were infected i.n with 50pfu of SARS-CoV-2. Results obtained with naïve, non-infected mice, are also depicted (black). At day 8 post infection SARS-CoV-2-specific CD8 T-cells were quantified by tetramer staining in the MLN (A-representative FACS analysis from each group and B-histograms incorporating the individual sets of results obtained for each animal) and the lung (C and D, see explanation for A and B above). Frequencies of effector cells were evaluated by CD62L staining (E and F, see explanation for A and B above). Bars indicate means ± SEM from 3–6 animals per group. Gating strategies for A-B and C-E appear in S5 and S6 Figs, respectively. P values: *P < 0.05, **P < 0.01.

