. 2023 Dec 27;12:RP88795. doi: 10.7554/eLife.88795

Figure 1. Δ9-THC exposure induces the proliferation of ESCs but not EpiLCs (A) Diagram illustrating Δ9-THC exposure scheme and experimental strategy.

bFGF: basic fibroblast growth factor, ESCs, embryonic stem cells; EpiLCs, epiblast-like cells; LIF, leukemia inhibitory factor. (B, E, H) Whisker boxplot indicating the median cellular viability of stem cells exposed to the different Δ9-THC doses and associated errors. (C, F, I) Whisker boxplot indicating the median number of viable cells exposed to the different Δ9-THC doses indicated and associated errors. (D, G, J) Whisker boxplot indicating the median percentage of BrdU-stained cells exposed to the different Δ9-THC doses and associated errors. ESCs exposed cells are presented in (B, C and D). EpiLCs exposed cells deriving from unexposed ESCs are presented in (E, F and G). EpiLCs exposed cells deriving from exposed ESCs are presented in (H, I and J). At least three independent biological repeats with three technical replicates (N=3, n=3). Statistical significance: *(p<0.05), **(p<0.01), ***(p<0.001), ****(p<0.0001).

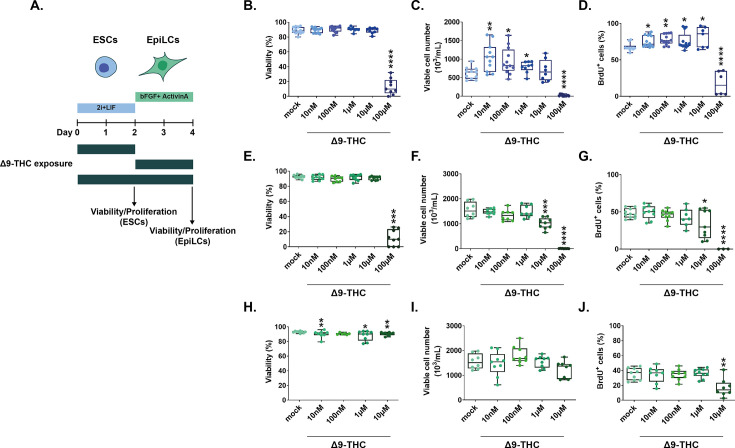
Figure 1.

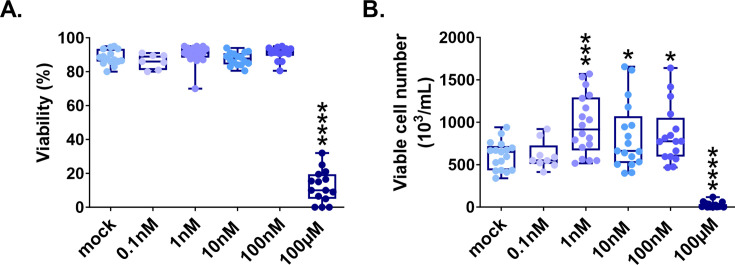
Figure 1—figure supplement 1. Δ9-THC induces ESCs proliferation for as low as 1 nM.

Figure 1—figure supplement 1.

(A) Whisker boxplot indicating the median cellular viability of ESCs exposed to the different Δ9-THC doses and associated errors. (B) Whisker boxplot indicating the median number of viable cells exposed to the different Δ9-THC doses indicated and associated errors. At least three independent biological repeats with three technical replicates (N=3, n=3). Statistical significance: *(p<0.05), ***(p<0.001), ****(p<0.0001).
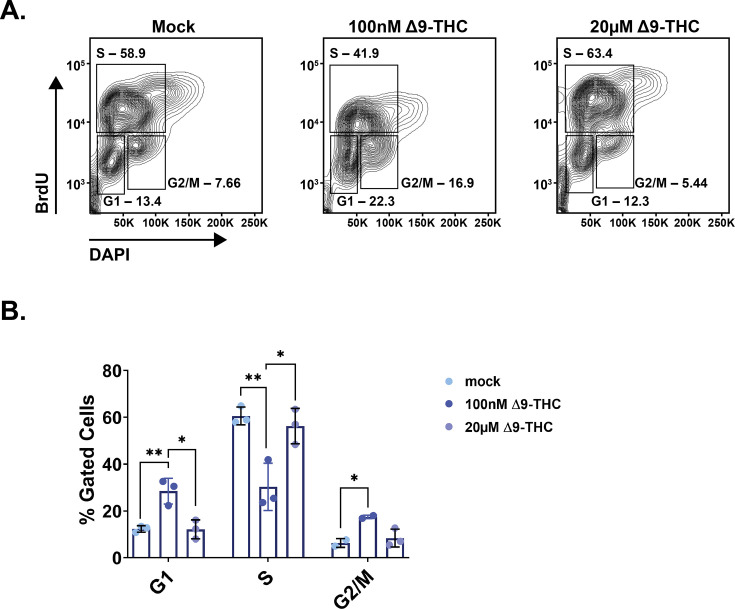
Figure 1—figure supplement 2. Δ9-THC induces alteration in ESCs cell cycle.

Figure 1—figure supplement 2.

(A) Representative flow contour plots showing distribution of BrdU-stained and DAPI-stained cells, exposed to the different doses of Δ9-THC indicated. The frequency of events in each gate is indicated. (B) The median percentage of events and associated errors for each cell cycle gate were plotted in histograms. At least three independent biological repeats with three technical replicates (N=3, n=3). Statistical significance: *(p<0.05), **(p<0.01).
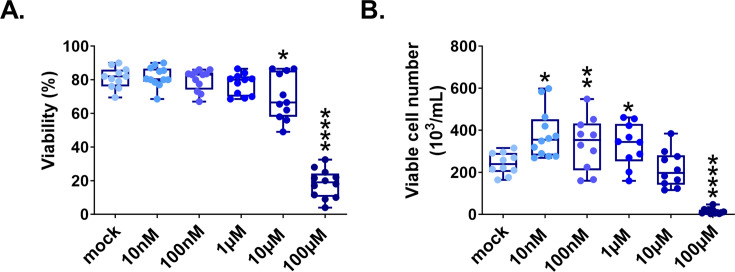
Figure 1—figure supplement 3. Δ9-THC exposure in male ESCs also provokes cell proliferation.

Figure 1—figure supplement 3.

(A) Whisker boxplot indicating the median cellular viability of male ESCs (the R8 cell line, see Materials and methods section) exposed to the different Δ9-THC doses and associated errors. (B) Whisker boxplot indicating the median number of viable cells exposed to the different Δ9-THC doses indicated and associated errors. At least three independent biological repeats with three technical replicates (N=3, n=3). Statistical significance: *(p<0.05), **(p<0.01), ****(p<0.0001).
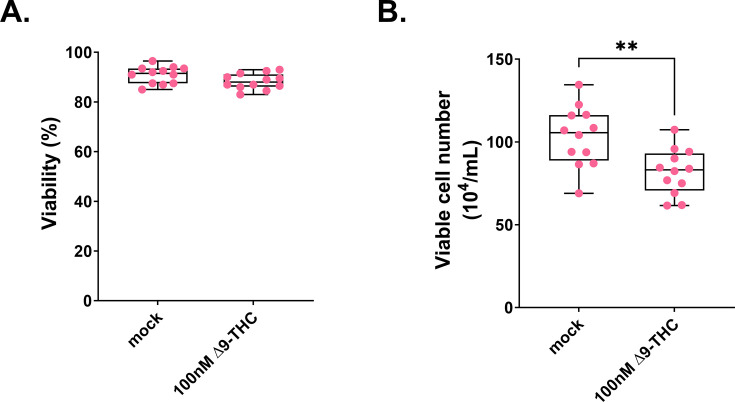
Figure 1—figure supplement 4. hESCs cell number decreases upon Δ9-THC exposure.

Figure 1—figure supplement 4.

(A) Whisker boxplot indicating the median cellular viability of human embryonic stem cells continuously exposed to 100 nM Δ9-THC doses over 6 days and associated errors. (B) Whisker boxplot indicating the median number of viable cells exposed to 100 nM of Δ9-THC doses indicated and associated errors. For (A and B), six technical repeats of two biological repeats (n=12) were plotted. Statistical significance: **(p<0.01).